How to Read a Topographic Map: Start With the Interval
The Reading Room Published
Short answer
Read a topographic map from the margin inward. Find the scale and contour interval before anything else: the same line spacing can mean a gentle slope on one sheet and a steep slope on another.
Viewing card
- Where
- Teton Range, Wyoming, on the USGS Grand Teton sheets; landform panels near 43.74°–43.77° N, 110.79°–110.88° W (map frames of the sheets and figures on this page)
- Seen from
- Map view from above: the USGS Grand Teton sheet at 1:125,000 with 100 ft contours, US Topo Grand Teton at 1:24,000 with 80 ft contours, and the USGS 3DEP elevation model contoured every 40 m (scales and intervals as printed in each margin; contours of the elevation model are this page's calculation, not a field survey)
- Captured
- 1929 printing of a sheet surveyed in 1899 (edition 1901, reprinted 1923); US Topo 2021; DEM USGS 3DEP 1/3 arc-second, n44w111 2025-01-23 (printing and data dates, not the date the ground looked like this)
- Reading altitude
- On a map: scale and interval. At 1:125,000, 1 mm on the sheet is 125 m on the ground, and a rise of less than 100 ft (30.48 m) can fall between two lines (this page's calculation; approximate)
- Written by
- A survey party drawing the ground as level lines: topography by T. M. Bannon and Arthur Stiles, surveyed in 1899 (as printed on the sheet)
This card as data (CSV) About this file
Data: Data available from U.S. Geological Survey, National Geospatial Program.
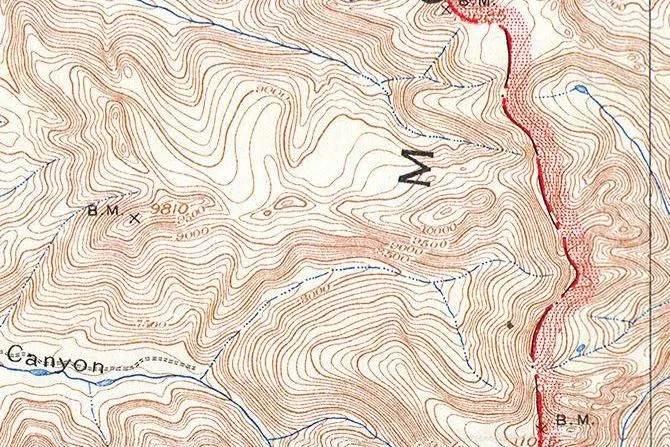
Part of the USGS topographic sheet for Grand Teton, Wyoming, in its 1929 printing, turned so north is up: brown contours every 100 feet crowd along the crest of the Teton Range, and the red line is one of the additions the National Park Service made in 1929.
“Teton Range crest (detail), from Grand Teton Quadrangle, Wyoming, USGS topographic sheet, 1929 printing”, U.S. Geological Survey; public domain.
Full credit
"Teton Range crest (detail), from Grand Teton Quadrangle, Wyoming, USGS topographic sheet, 1929 printing" by U.S. Geological Survey — https://commons.wikimedia.org/wiki/File:1929_U.S.G.S._Map_of_Grand_Teton_National_Park,_Wyoming_-_Geographicus_-_GrandTeton-USGS-1929.jpg — Public domain (US: U.S. Government work (17 U.S.C. §105), USGS topographic sheet surveyed 1899 and first published 1901, this printing 1929 with National Park Service additions; EU: published by U.S. federal agencies more than 70 years ago); modified: cropped, rotated
Before tracing a single line on a topographic map, read the small print along its bottom edge. That is the advice of USGS Professional Paper 60, The Interpretation of Topographic Maps by Rollin Salisbury and Wallace Atwood (1908): “In the study of contour maps the scale of the map and the contour interval should be noted at the outset” (p. 18). The same page adds that it “is also well to note the location of the area which the map represents.”
This page follows that order on two USGS sheets of the same mountains: the Grand Teton sheet in its 1929 printing, and the US Topo map of the Grand Teton quadrangle, published in 2021. One rule, how contours bend where a stream crosses them, has a page of its own on contour lines; this page covers the rest of the sheet, from the margin to the colors, the shapes and the profile.
Start with the margin: scale, interval and date
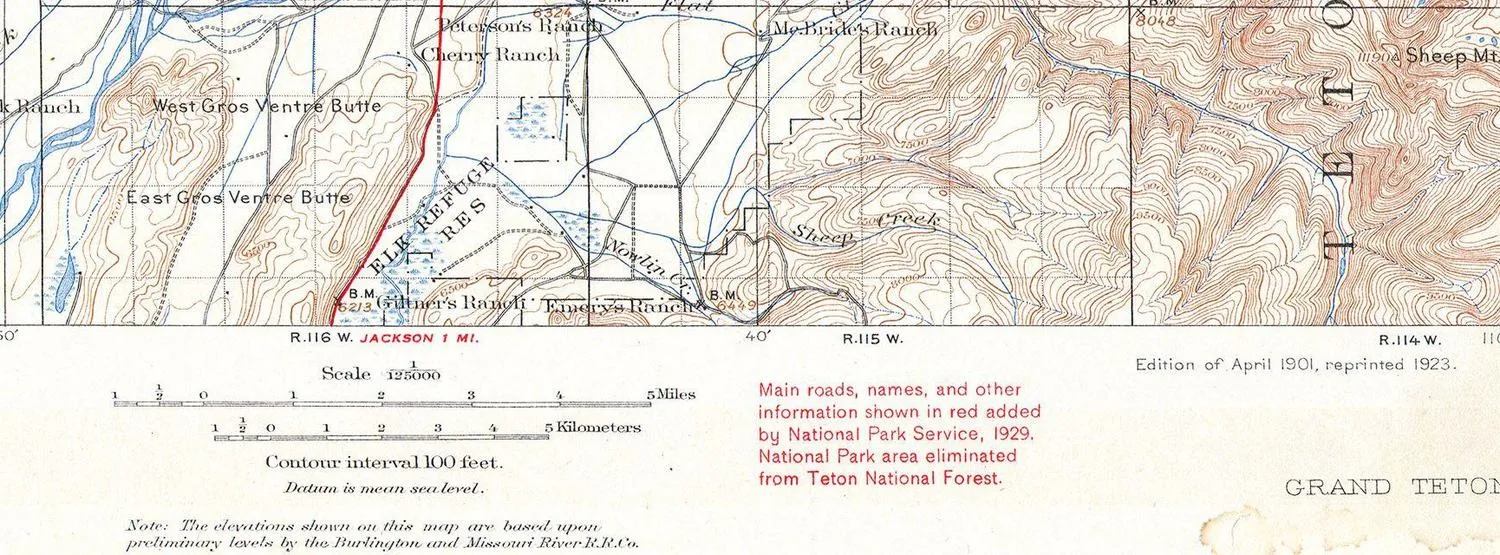
The south margin of the 1929 printing, turned so north is up. It gives a scale of 1:125,000 with bars in miles and kilometers, a contour interval of 100 feet and the datum, mean sea level. On the right are the edition date and the red note on the 1929 additions.
"South margin (detail), from Grand Teton Quadrangle, Wyoming, USGS topographic sheet, 1929 printing" by U.S. Geological Survey — https://commons.wikimedia.org/wiki/File:1929_U.S.G.S._Map_of_Grand_Teton_National_Park,_Wyoming_-_Geographicus_-_GrandTeton-USGS-1929.jpg — Public domain (US: U.S. Government work (17 U.S.C. §105), USGS topographic sheet surveyed 1899 and first published 1901, this printing 1929 with National Park Service additions; EU: published by U.S. federal agencies more than 70 years ago); modified: cropped, rotated
The margin, also called the collar, is the frame of printed information around the map itself. Professional Paper 60 explains that the contour interval “is stated at the bottom of each map” and that the names of the adjoining sheets are printed on the margins (p. 12). The modern USGS leaflet Topographic Map Symbols still says the interval is printed in the margin of each USGS map.
On the 1929 printing, the margin gives a scale of 1:125,000, so one millimeter on the paper represents 125 m on the ground, and one inch represents about 1.97 miles. The contour interval is 100 feet, or about 30.48 m. A note adds that the heights are “based upon preliminary levels by the Burlington and Missouri River R.R. Co.,” so the starting elevations came from a railroad company’s leveling.
The 2021 US Topo collar gives a scale of 1:24,000, where one inch represents 2,000 feet. Its contour interval is 80 feet, and its elevations refer to the North American Vertical Datum of 1988. The collar also lists the adjoining quadrangles, among them Mount Moran, Jenny Lake and Moose, and includes a diagram of magnetic north for 2019.
Every sheet makes the cartographer’s cut: whatever a map leaves out, merges or bends so that it can be read at all. On the 1929 printing, the main cut is the 100-foot interval. A knoll or hollow less than about 30 m high can fall between two neighboring lines and leave no trace on the paper.
How old is the map? Count the dates
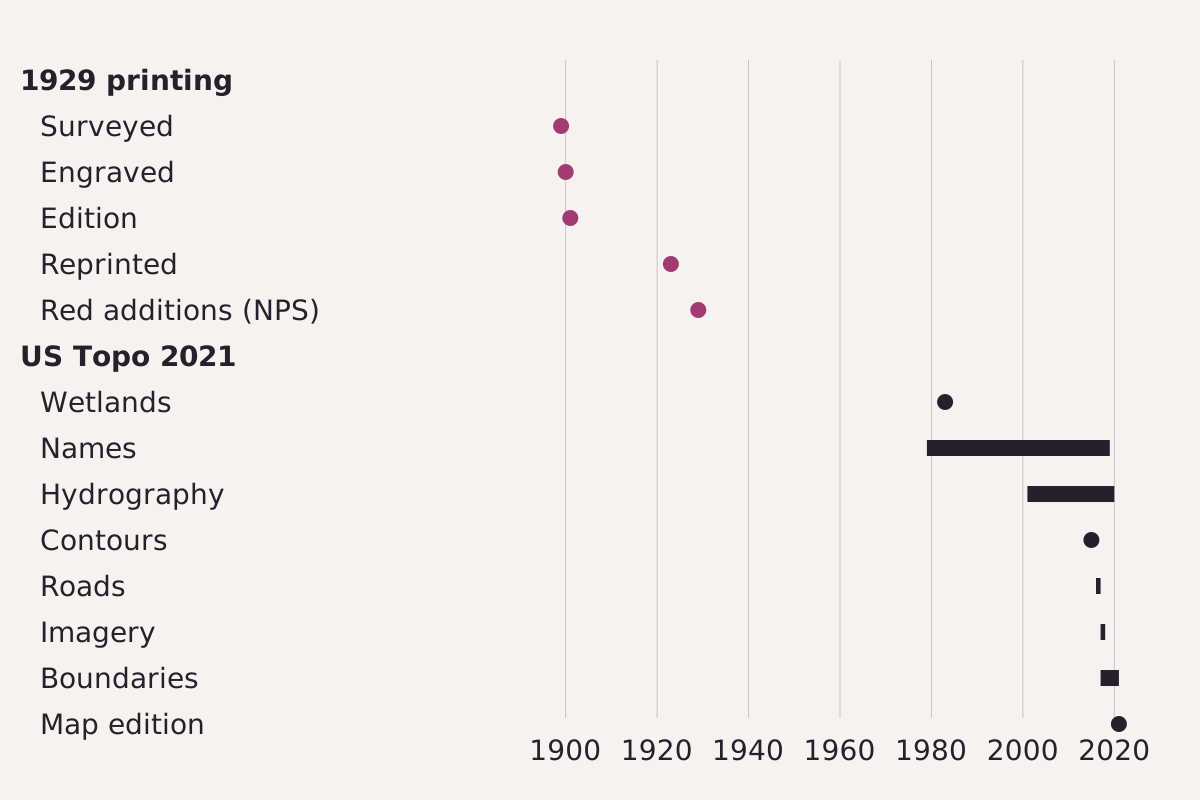
Dates printed on the two sheets. The 1929 printing carries five, from the survey in 1899 to the red additions; the 2021 US Topo lists a source year or span for each layer.
Benchmark Each row taken from this page’s CSV; sources and years in the table.
"Dates printed on two Grand Teton sheets, 1899 to 2021" by Meridian & Moraine, https://meridianandmoraine.com/contours/how-to-read-a-topographic-map/, licensed under CC BY 4.0 (https://creativecommons.org/licenses/by/4.0/).
Data: USGS topographic sheets, public domain
The copy of the older sheet used here is titled with 1929, but its margins reach further back. At the west end of the south margin, the sheet reads “Surveyed in 1899,” with topography by T. M. Bannon and Arthur Stiles under E. M. Douglas, geographer in charge, and “Engraved Nov. 1900 by U.S.G.S.” Farther east, the same margin adds “Edition of April 1901, reprinted 1923.” A red note then explains that the National Park Service added main roads, names and other information in red in 1929.
The brown contours on this printing therefore record the ground as it was surveyed in 1899, and only the red lines and names belong to 1929. The newest date on a sheet can be the date of a printing, not the date of the survey behind most of what it shows.
The US Topo collar goes further and dates each layer separately. Its contours come from the National Elevation Dataset of 2015, its imagery from October 2017 to January 2018, and its roads from the Census Bureau, 2016 to 2017. The names span 1979 to 2019, and the wetlands layer dates from 1983.
| Sheet | Layer or event | Year or years | Where it is printed |
|---|---|---|---|
| Grand Teton, 1929 printing | Surveyed | 1899 | south margin |
| Grand Teton, 1929 printing | Engraved | 1900 | south margin |
| Grand Teton, 1929 printing | Edition | 1901 | south margin |
| Grand Teton, 1929 printing | Reprinted | 1923 | south margin |
| Grand Teton, 1929 printing | Red additions by the National Park Service | 1929 | south margin |
| US Topo Grand Teton | Wetlands | 1983 | collar |
| US Topo Grand Teton | Names | 1979–2019 | collar |
| US Topo Grand Teton | Hydrography | 2001–2020 | collar |
| US Topo Grand Teton | Contours | 2015 | collar |
| US Topo Grand Teton | Roads | 2016–2017 | collar |
| US Topo Grand Teton | Imagery | 2017–2018 | collar |
| US Topo Grand Teton | Boundaries | 2017–2021 | collar |
| US Topo Grand Teton | Map edition | 2021 | collar |
Download the dates on both sheets (CSV) (about this file) Data: USGS topographic sheets, public domain
Purple marks are another clue to age. Topographic Map Symbols says that purple was once used as a revision color for feature changes, that it is no longer used that way, and that purple features “are still present on many existing maps.” An old sheet can also carry the errors of its own time; on the page about California drawn as an island, the map itself is the record of what its makers knew.
What do the colors and symbols mean?
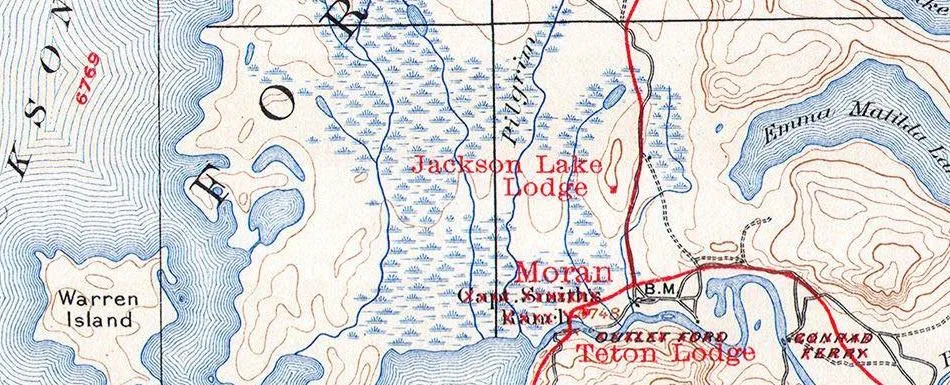
Near the outlet of Jackson Lake on the 1929 printing, turned so north is up: blue lines follow the lake shore, blue tufts mark marsh, brown contours mark the hills, and black lines mark roads and the land grid. The red roads and names, such as Jackson Lake Lodge and Moran, are the National Park Service additions.
“Jackson Lake outlet near Moran (detail), from Grand Teton Quadrangle, Wyoming, USGS topographic sheet, 1929 printing”, U.S. Geological Survey; public domain.
Full credit
"Jackson Lake outlet near Moran (detail), from Grand Teton Quadrangle, Wyoming, USGS topographic sheet, 1929 printing" by U.S. Geological Survey — https://commons.wikimedia.org/wiki/File:1929_U.S.G.S._Map_of_Grand_Teton_National_Park,_Wyoming_-_Geographicus_-_GrandTeton-USGS-1929.jpg — Public domain (US: U.S. Government work (17 U.S.C. §105), USGS topographic sheet surveyed 1899 and first published 1901, this printing 1929 with National Park Service additions; EU: published by U.S. federal agencies more than 70 years ago); modified: cropped, rotated
The 1908 manual sorts everything on a topographic map into three groups: water, relief, and “culture, i. e., works of man” (p. 11). In its time, water features were printed in blue and relief in brown. Works of man were printed in black, the color in which “all lettering also is printed” (p. 12).
Topographic Map Symbols keeps that base and adds more. Features appear as points, lines or areas, depending on their size and extent. Contours are brown and water features are blue; land grids and important roads are red, while other roads, railroads, boundaries and cultural features are black. The leaflet notes that “the first features usually noticed” are the area features: vegetation in green, water in blue, and densely built-up areas in gray or red.
| Feature | Color | Source |
|---|---|---|
| Contours | brown | Topographic Map Symbols; Professional Paper 60, p. 11 |
| Lakes, streams and other water features | blue | Topographic Map Symbols; Professional Paper 60, p. 11 |
| Land grids and important roads | red | Topographic Map Symbols |
| Other roads, railroads, boundaries, buildings | black | Topographic Map Symbols; Professional Paper 60, p. 12 |
| Vegetation | green (area feature) | Topographic Map Symbols |
| Densely built-up areas | gray or red (area tint) | Topographic Map Symbols |
| Feature changes on revised maps | purple (no longer used) | Topographic Map Symbols |
| Main roads and names added in 1929 | red | Grand Teton sheet, 1929 printing |
Download the colors and symbols (CSV) (about this file) Data: USGS publications, public domain
The last row matters most. On the 1929 printing, red marks what the National Park Service added that year: main roads, but also names and other information. Before trusting any color, check the legend or the margin notes of the sheet in hand. The same brown contour base also carries the colors of the rocks on a geologic map.
The colors say more when read together. On one of its first plates, the 1908 manual points out that most roads there “occupy the divides between the valleys” (p. 19). On a rougher sheet, it notes that the railways follow the valleys, that the wagon roads, less dependent on grade, cross considerable heights in places, and that most settlements sit on the valley flats (p. 19). Black lines laid over brown ones show where the ground made travel easy or hard.
Reading shape: hills, valleys and saddles
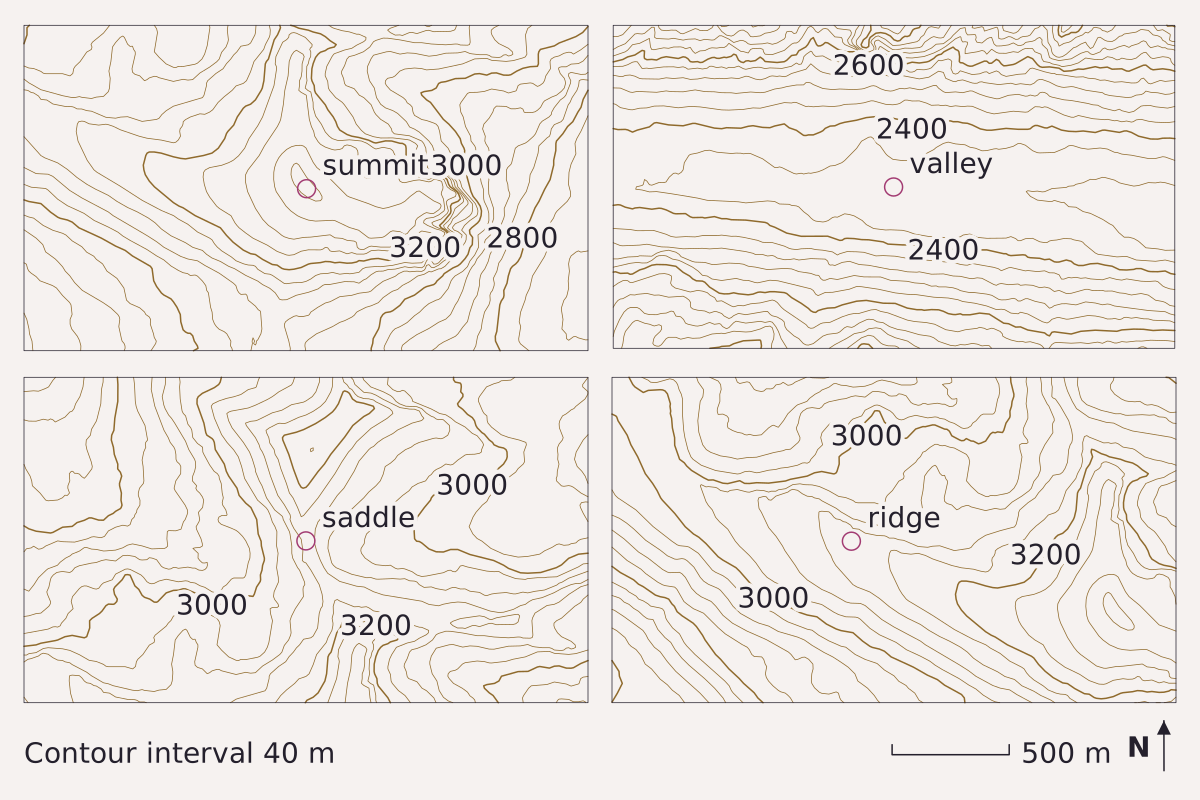
Four windows on the Teton Range, each about 2.4 km wide and drawn every 40 m at one scale: a summit, a valley, a saddle and a ridge, in that order. Elevation: USGS 3DEP 1/3 arc-second, n44w111 2025-01-23.
Benchmark Contours from USGS 3DEP 1/3 arc-second DEM; interval 40 m; 5 points checked against the DEM; map corners recomputed from the DEM's georeferencing.
"Summit, valley, saddle and ridge in the Teton Range, contoured at a 40 m interval" by Meridian & Moraine, https://meridianandmoraine.com/contours/how-to-read-a-topographic-map/, licensed under CC BY 4.0 (https://creativecommons.org/licenses/by/4.0/).
Data: Data available from U.S. Geological Survey, National Geospatial Program.
Once the interval is known, read the shapes. A summit appears as a set of closed rings. Each is smaller than the one outside it. In the first panel, the top of the elevation model sits at about 3,383 m inside the smallest ring.
A saddle is the low point on a crest between two higher spots. In the third panel it sits at about 3,145 m, with a knob of about 3,240 m to the north and the summit of about 3,383 m to the south. On the map, closed or bending lines rise toward the higher ground on two sides, while the lines on the other two sides fall away.
A ridge and a valley both make bends, but their bends point in opposite directions. Along the ridge in the fourth panel, the lines bend into U shapes that point downhill. In the valley panel, long lines run along both walls, and the floor near 2,330 m is almost empty, which marks nearly level ground. Where a stream cuts across the lines, they bend the other way, up the valley, and Contour Lines covers that rule.
How do you find the elevation of a point?
To find the height of a point, start from the wider, numbered index contours. In these panels every fifth line is wider, so index lines fall every 200 m, at 2,400, 2,600 and so on, and each step between neighboring lines adds or subtracts 40 m. The 1908 manual adds that the heights of summits, road corners and bench marks are printed beside the points themselves (p. 12). On the 1929 sheet, “B.M.” marks a bench mark, as with the 9810 (feet) near the crest in the lead image.
| Point | Latitude | Longitude | Model elevation (m) | Contour drawn (m) | Difference (m) |
|---|---|---|---|---|---|
| P1 | 43.7640° N | 110.7930° W | 2,319.98 | 2,320 | −0.02 |
| P2 | 43.7430° N | 110.8403° W | 2,759.94 | 2,760 | −0.06 |
| P3 | 43.7483° N | 110.8726° W | 2,960.05 | 2,960 | 0.05 |
| P4 | 43.7475° N | 110.8452° W | 3,118.46 | 3,120 | −1.54 |
| P5 | 43.7474° N | 110.8529° W | 3,359.94 | 3,360 | −0.06 |
Download the five check points (CSV) (about this file) Data: Data available from U.S. Geological Survey, National Geospatial Program.
The table compares the drawing with the elevation model at five points, and all five agree to within 1.54 m. Each panel also has a cut of its own: it is a small window around one landform, so the ground that gives it context lies outside the frame, and a rise of less than 40 m can slip between two lines. Shaded relief draws the same kind of ground with light and shadow instead of lines.
Drawing a profile across the map
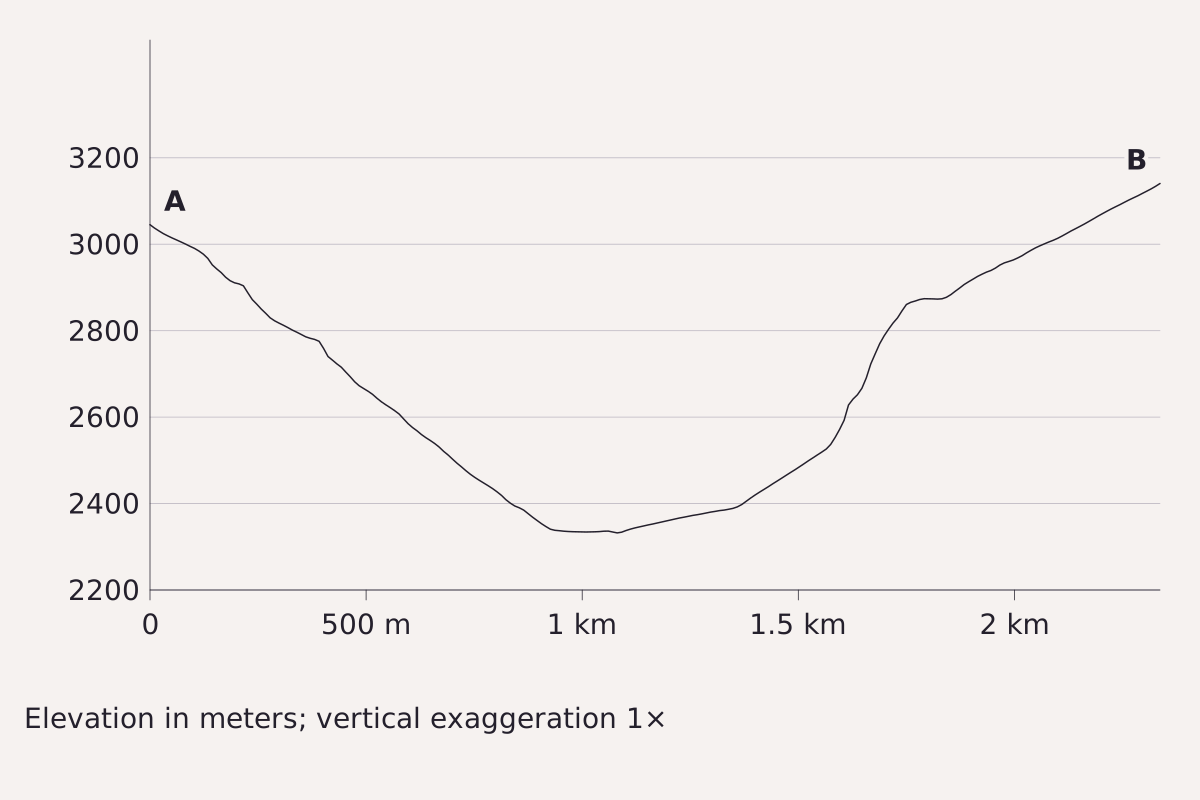
A slice across the second panel and past both its edges, from A (43.7545° N, 110.7999° W) to B (43.7755° N, 110.7999° W), about 2.3 km south to north, with no vertical stretch. The steep walls and the broad floor make a U, the shape the panel’s widely spaced floor lines describe. Elevation: USGS 3DEP 1/3 arc-second, n44w111 2025-01-23.
Benchmark Profile from USGS 3DEP 1/3 arc-second DEM; vertical exaggeration 1×; 5 points checked against the DEM.
"Elevation profile across a Teton Range valley, no vertical exaggeration" by Meridian & Moraine, https://meridianandmoraine.com/contours/how-to-read-a-topographic-map/, licensed under CC BY 4.0 (https://creativecommons.org/licenses/by/4.0/).
Data: Data available from U.S. Geological Survey, National Geospatial Program.
A profile turns the map into a side view along one line. The 1908 manual advises anyone who wants to understand topographic maps well to “draw sections showing the profile of the surface along selected lines” (p. 19). It also warns that the vertical scale is often stretched, and that “the amount of vertical exaggeration in the profile should always be noted.”
To draw one by hand from a paper map:
- Draw a straight line from A to B across the features of interest.
- Lay a strip of paper along the line and tick each place where a contour crosses it, writing that contour’s height beside the tick.
- Move the strip to graph paper and keep the horizontal scale of the map, which the manual calls usually convenient.
- Choose a vertical scale, plot each tick at its height, and write down the vertical exaggeration.
- Join the points with a smooth line, keeping any hills and hollows that the contours show between ticks.
The profile above uses no stretch at all. From A at about 3,040 m, the ground falls about 700 m to a floor near 2,330 m, then rises to about 3,140 m at B, all within about 2.3 km. Its cut is the line itself: a side gully a few meters off the line does not appear, and at true vertical scale small steps look almost flat.
What the 1908 USGS manual still teaches
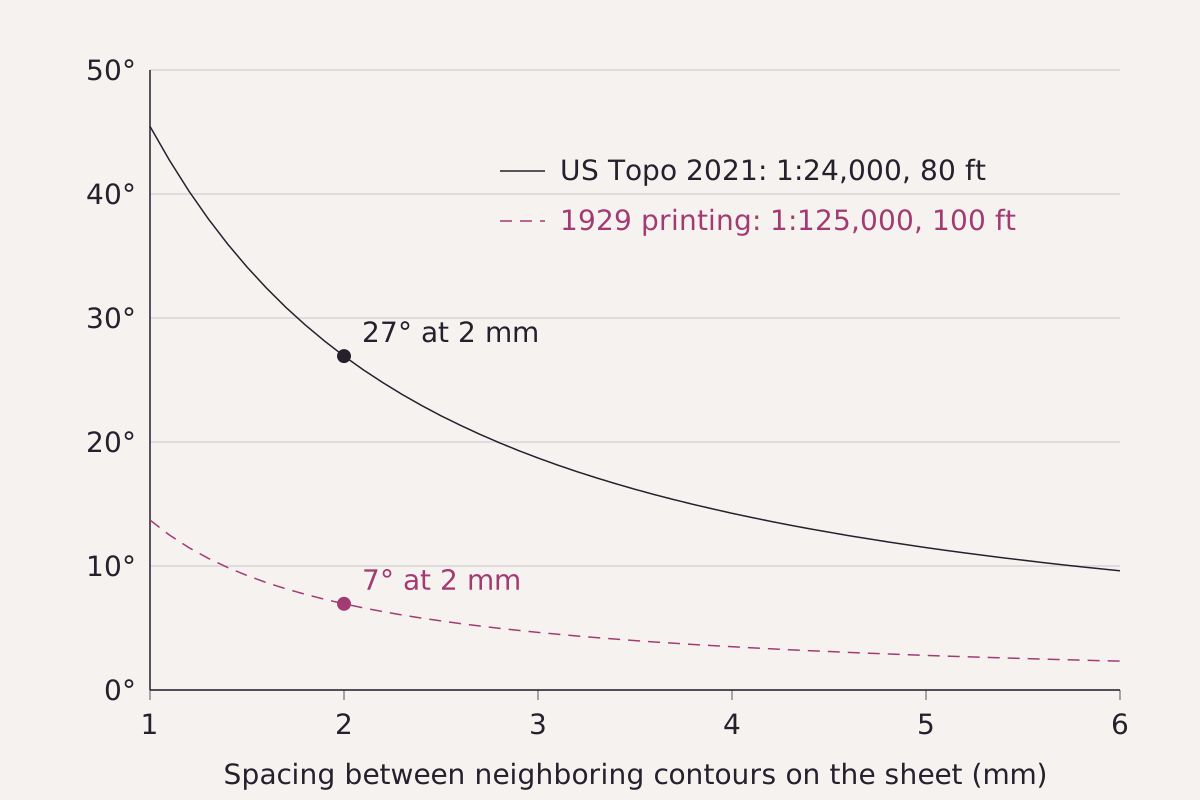
The slope that one spacing between neighboring contours stands for on each Grand Teton sheet, from 1 to 6 mm on the paper. At 2 mm, the US Topo (1:24,000, 80 ft) gives about 27°; the 1929 printing (1:125,000, 100 ft) gives about 7°.
Benchmark Slopes computed from each sheet’s printed scale and contour interval; every value in this page’s CSV and in the table below.
"Slope shown by one spacing between contour lines on two Grand Teton sheets" by Meridian & Moraine, https://meridianandmoraine.com/contours/how-to-read-a-topographic-map/, licensed under CC BY 4.0 (https://creativecommons.org/licenses/by/4.0/).
Data: USGS topographic sheets and Professional Paper 60, public domain
Professional Paper 60 described itself as “a sort of laboratory map manual for the use of students” (p. 10). Its 170 plates run from a sheet of conventional signs to glaciers, coastlines and volcanoes. The first fifteen, a preliminary series, are meant “to familiarize the reader with topographic maps” (p. 18).
The manual shows how to turn spacing into steepness, which it says “may be determined by means of the contour interval and the horizontal scale of the map” (p. 19). On one plate, eight contours at a 20-foot interval are “crowded into one-sixteenth of an inch,” and the manual reads the slope as “about 160 feet in 110 yards.” That works out to a slope of about 25.9°.
Then it shows the trap. Two plates of plain country use the same interval, but one is drawn at half the scale of the other, so its contours crowd together and give “an undue impression of the comparative roughness” (p. 20). Of a mountain map with a large interval, the manual adds that “their crowding is more significant of steep slopes than if the interval were smaller” (p. 21).
| Sheet | Scale | Interval | Lines 1 mm apart | Lines 2 mm apart | Lines 5 mm apart |
|---|---|---|---|---|---|
| US Topo Grand Teton, 2021 | 1:24,000 | 80 ft | 45.5° | 26.9° | 11.5° |
| Grand Teton, 1929 printing | 1:125,000 | 100 ft | 13.7° | 7.0° | 2.8° |
Download the slope table (CSV) (about this file) Data: USGS topographic sheets and Professional Paper 60, public domain
The chart puts numbers on that trap. Lines 2 mm apart represent about 27° on the 2021 sheet and about 7° on the 1929 printing, because each millimeter covers 24 m of ground on one sheet and 125 m on the other. These values describe a single spacing between two lines; the real ground changes slope between them.
When lines drop out
The interval itself can change within a sheet. On a canyon map with intervals of 25, 50 and 100 feet, the manual explains that some lines are dropped on steep slopes where they would crowd too closely, so a contour may end abruptly and the interval beyond it doubles (pp. 20–21). The manual also marks the limits of its own readings: where an explanation rests only on the features of the map and not on knowledge of the field, it is to be “regarded as tentative only” (p. 10).
On the next topographic map, start at the bottom margin. Read the scale and the contour interval, find every date, and then pick two lines that look close together and work out how many meters of ground lie between them before deciding that the slope is steep.
Next overpass
- Contour lines: the one rule on the whole sheet worth learning by heart: where a stream crosses, the lines point upstream.
- How to read a geologic map: the same brown contour base, with the colors of the rocks laid over it.
Sources
- Rollin D. Salisbury and Wallace W. Atwood, The Interpretation of Topographic Maps, U.S. Geological Survey Professional Paper 60 (Washington: Government Printing Office, 1908). pubs.usgs.gov/pp/0060/report.pdfRead: pages 10–12 and 18–21, from the PDF text layer
- U.S. Geological Survey, Topographic Map Symbols, U.S. Geological Survey Unnumbered Series, General Interest Product, 4 p. (2005; revised June 5, 2008). pubs.usgs.gov/gip/TopographicMapSymbols/topomap…Read: full text of the 'What is a Topographic Map?' and 'Reading Topographic Maps' panels, and the contour symbol list (PDF text layer; the leaflet has no page numbers)
- U.S. Geological Survey, Wyoming (Teton County), Grand Teton Quadrangle, scale 1:125,000, contour interval 100 feet; surveyed 1899, edition of April 1901, reprinted 1923, with information added in red by the National Park Service, 1929. commons.wikimedia.org/wiki/File:1929_U.S.G.S._Map_of_Gr…Read: file page and full sheet, margins included, read from the full-resolution scan
- U.S. Geological Survey, US Topo 7.5-minute map for Grand Teton, WY 2021, scale 1:24,000 (National Geospatial Program, published 2021-08-12). prd-tnm.s3.amazonaws.com/StagedProducts/Maps/USTopo/PDF/WY…Read: section: map collar only (scale, contour interval, datum, data sources and years, adjoining quadrangles)
- U.S. Geological Survey, 3D Elevation Program 1/3 arc-second Digital Elevation Model, tile n44w111 (USGS 1/3 Arc Second n44w111 20250122, publication date 2025-01-23), The National Map. prd-tnm.s3.amazonaws.com/StagedProducts/Elevation/13/TIFF/…Read: values: elevation grid for the Teton Range windows near 43.74–43.78° N, 110.78–110.88° W

Cite this page
The Reading Room. “How to Read a Topographic Map: Start With the Interval.” Meridian & Moraine, published 16 November 2026. https://meridianandmoraine.com/contours/how-to-read-a-topographic-map/. Accessed on the date you read it.
How readings are checkedAll correctionsReport an error on this page (contact@meridianandmoraine.com)
More from Contours & Charts
Contours & Charts
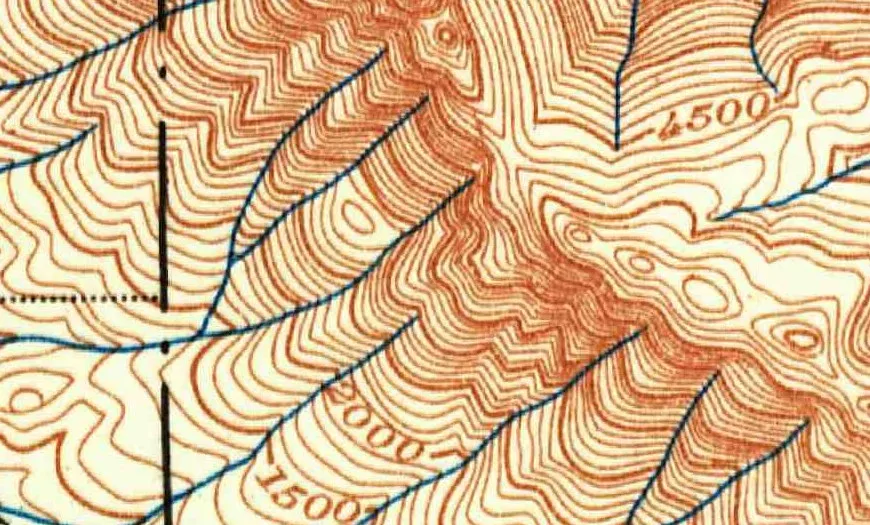
Contour Lines: A V Pointing Uphill Marks a Stream Valley
Image credit
"Skykomish, Washington, topographic sheet (detail near Baring), 1902" by U.S. Geological Survey — https://commons.wikimedia.org/wiki/File:1902_USGS_topo_map_of_Baring,_Washington.jpg — Public domain (US: U.S. Government work (17 U.S.C. §105), USGS topographic sheet published 1902; EU: published 1902 by a U.S. federal agency, more than 70 years ago); modified: cropped
Contours & Charts
Shaded Relief: Why Maps Light Mountains From the Northwest
Image credit
"Blatt XVIII, Brieg, Airolo (detail around the Aletsch glaciers), from Topographische Karte der Schweiz (Dufour Map), 1854, by Guillaume-Henri Dufour and the Eidgenössisches Topographisches Bureau" by Federal Office of Topography swisstopo — https://commons.wikimedia.org/wiki/File:Swisstopo_Dufourkarte_BLATT_XVIII_BRIEG_AIROLO_LT_TK_018_1854.tiff — swisstopo terms of use for free geodata (https://www.swisstopo.admin.ch/en/terms-of-use-free-geodata-and-geoservices); modified: cropped, resized; rights notice: ©swisstopo
Contours & Charts
California as an Island: A Map Error Preserved in Print
Image credit
"Amerique Septentrionale (detail: California and the Mar Vermejo), map by Nicolas Sanson, Paris, 1650" by Nicolas Sanson — https://commons.wikimedia.org/wiki/File:Sanson_Amerique_Septentrionale_1650_UTA.jpg — Public domain (US: first published 1650, before 1931; EU: mapmaker Nicolas Sanson died 1667, more than 70 years ago); modified: cropped, resized