Shaded Relief: Why Maps Light Mountains From the Northwest
The Reading Room Published
Short answer
Two shaded relief maps of the same mountains can disagree: lit from the south, valleys can read as ridges. A 2018 paper by Çöltekin and colleagues blames the habit of assuming light comes from above.
Viewing card
- Where
- Cascade Range, Washington; frame of the three shaded maps, corners 47.750°–47.830° N, 121.270°–121.410° W
- Seen from
- Map view from above: USGS 3DEP 1/3 arc-second DEM, shaded three times with light 45° above the horizon; computed, not a photograph
- Captured
- USGS 1/3 Arc Second n48w122 20250813 (publicationDate 2025-08-13), read 2026-11-16; a data version, not a survey date
- Reading altitude
- In an image: about 12.9 m per pixel, 10.3 km wide; landforms a few tens of meters across blur away
- Written by
- A light direction chosen for the map, not the Sun, falling on the slopes of the elevation model
This card as data (CSV) About this file
Data: Data available from U.S. Geological Survey, National Geospatial Program.
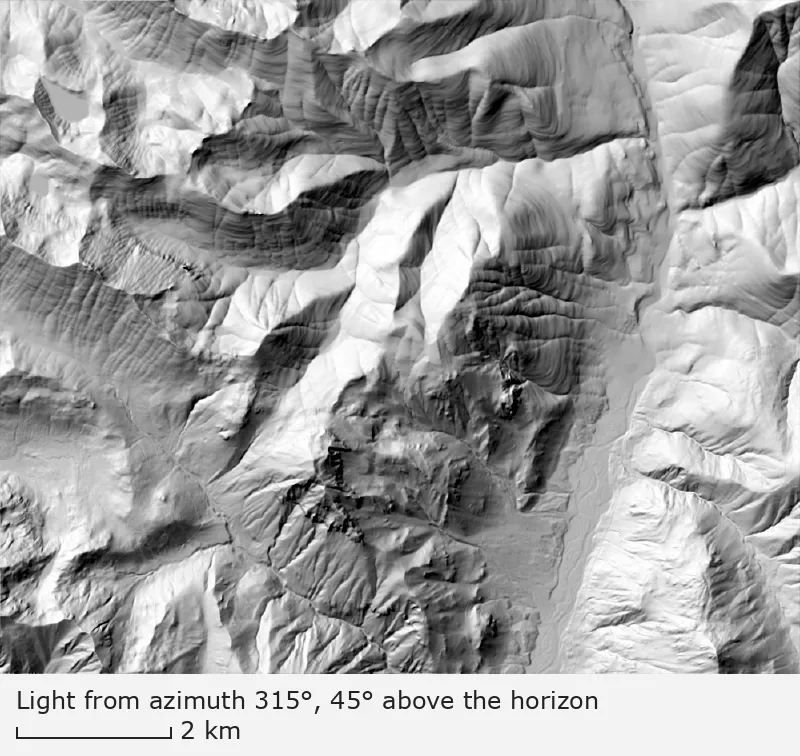
Light from the northwest (azimuth 315°), 45° above the horizon
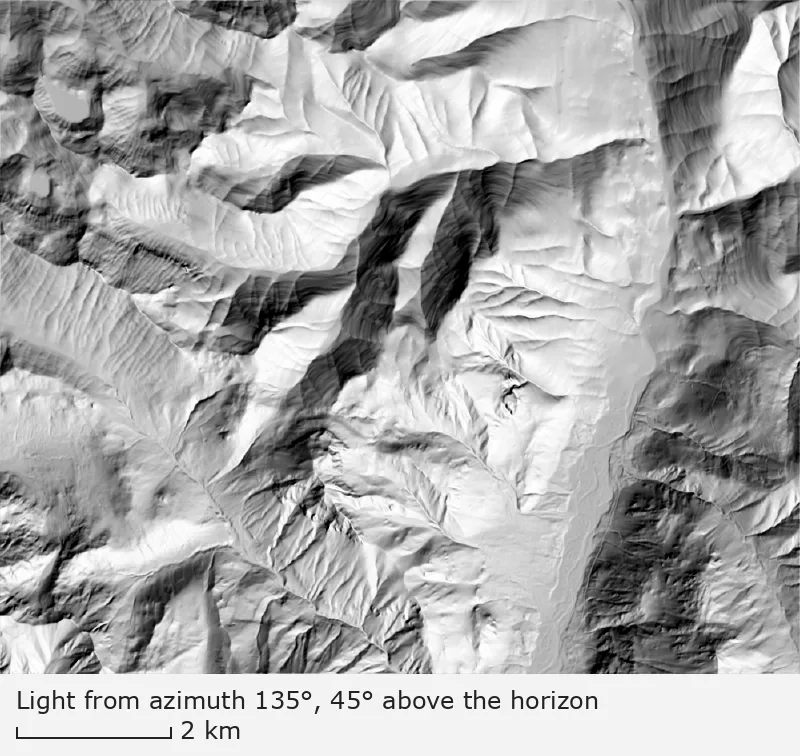
Light from the southeast (azimuth 135°), 45° above the horizon
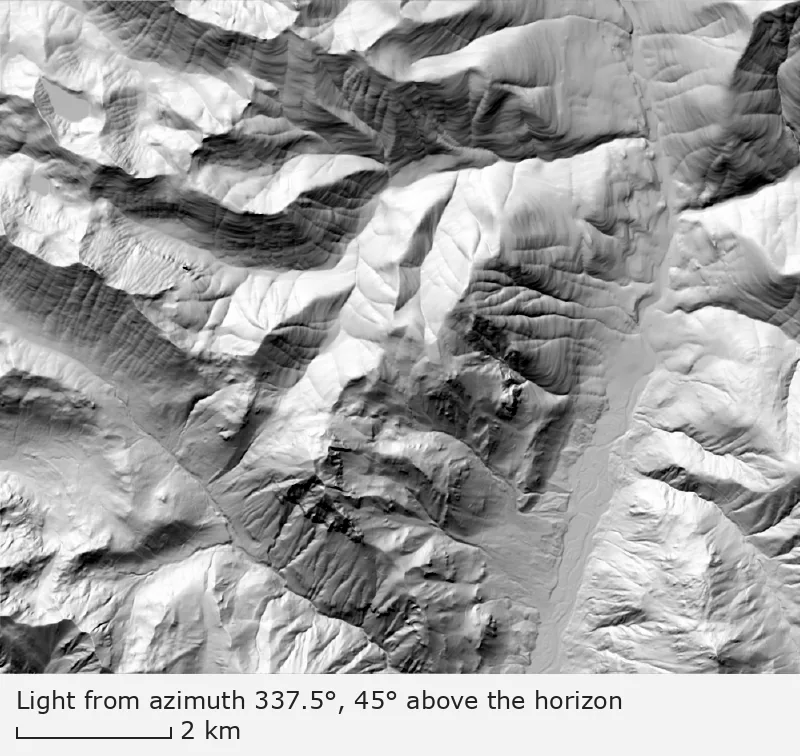
Light from the north-northwest (azimuth 337.5°), 45° above the horizon
One elevation model, three lights, each 45° above the horizon: from the northwest (315°), the convention the 2018 paper cites; from the southeast (135°); and from the north-northwest (337.5°). Cascade Range, Washington, near 47.79° N, 121.34° W, 10.3 km wide; north is up, with the map grid about 1.2° off true north. Elevation: USGS 3DEP 1/3 arc-second, n48w122 2025-08-13.
Benchmark Shaded relief from USGS 3DEP 1/3 arc-second DEM; light from azimuth 315°, 135°, 337.5°, 45° above the horizon; z-factor 1; map corners recomputed from the DEM's georeferencing.
"Shaded relief of a Cascade Range block, light from azimuth 315°, 45° above the horizon" by Meridian & Moraine, https://meridianandmoraine.com/contours/shaded-relief/, licensed under CC BY 4.0 (https://creativecommons.org/licenses/by/4.0/).
Data: Data available from U.S. Geological Survey, National Geospatial Program.
"Shaded relief of a Cascade Range block, light from azimuth 135°, 45° above the horizon" by Meridian & Moraine, https://meridianandmoraine.com/contours/shaded-relief/, licensed under CC BY 4.0 (https://creativecommons.org/licenses/by/4.0/).
"Shaded relief of a Cascade Range block, light from azimuth 337.5°, 45° above the horizon" by Meridian & Moraine, https://meridianandmoraine.com/contours/shaded-relief/, licensed under CC BY 4.0 (https://creativecommons.org/licenses/by/4.0/).
Light settings as data (CSV) Data: Data available from U.S. Geological Survey, National Geospatial Program.; Çöltekin, A., Rautenbach, V., Coetzee, S., and Mokwena, T. (2018), ISPRS Archives XLII-4, 101–106, CC BY 4.0
A shaded relief map, or hillshade, paints each slope bright or dark by how squarely it faces a light. Look at the broad, flat valley floor that runs down the right half of the map. Under the 315° light, its western wall, which faces east, is dark; switch to 135° and the same wall turns bright.
The ground is the same in all three images. Only the light moved, and between 315° and 135° most ridges traded their bright side for their dark one; slopes facing northeast or southwest keep the same shade under both lights.
Why does light from the south flip the terrain?
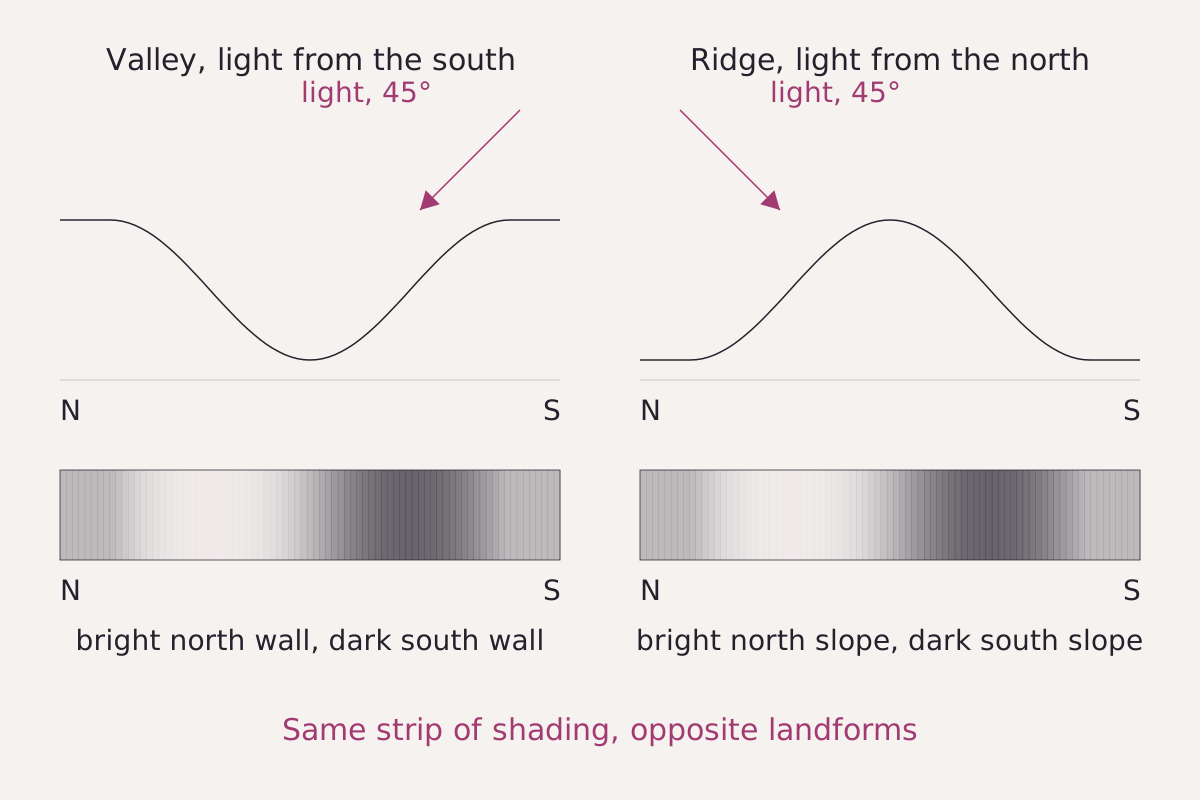
A made-up valley lit from the south and a made-up ridge lit from the north, each with the shading it gets along a north–south line, north at the left. The two strips match: bright on the north side, dark on the south. On a map with north at the top, the two landforms hand the eye the same pattern.
Benchmark Schematic, not to scale; shading computed with the cosine model used for the three maps, light 45° above the horizon; the two strips match exactly.
"A valley lit from the south and a ridge lit from the north, schematic" by Meridian & Moraine, https://meridianandmoraine.com/contours/shaded-relief/, licensed under CC BY 4.0 (https://creativecommons.org/licenses/by/4.0/).
Data: Çöltekin, A., Rautenbach, V., Coetzee, S., and Mokwena, T. (2018), ISPRS Archives XLII-4, 101–106, CC BY 4.0
The trouble starts in the eye, not in the map. The visual system tends to assume that light comes from above, which the 2018 paper calls the “light from above prior,” crediting the idea to Mamassian and Goutcher (2001). On a map laid flat with north at the top, above means north.
Light from the south puts the shadows on slopes that face north instead. Çöltekin and colleagues (2018) write that shadows on the northern slopes, “thus when light source placed broadly in south, mislead the cognitive system.” Hollow and raised shapes swap places, an effect called relief inversion: a valley can read as a ridge, and a ridge as a valley. The figure shows why: a valley lit from the south gives the same strip of light and dark that a ridge lit from the north gives.
Not every viewer falls for it, and not every time. The 2018 paper is one replication study, run with 87 university students in South Africa, aged 20 to 29. Each judged 40 shaded maps, half showing a ridge and half a valley, on a five-point scale from “clearly a valley” to “clearly a ridge.”
Every map in that study was lit from the northwest quarter of the compass, at 270°, 292.5°, 315°, 337.5° or 0°. Light from the south was not tested there; the original study it repeated also covered eastern and southern light, the 2018 paper reports. Accuracy rose as the light moved toward north. Light from 337.5° gave higher accuracy than the usual 315° (p = 0.018), and light from due north did about as well.
Confidence could stay high while accuracy was low. With light from 270°, the students' average confidence stayed above about 70% while their average accuracy fell below about 60%. The authors recommend north-northwest light over northwest for shaded relief maps, on the strength of the original study and this one replication.
How the Dufour map shades its mountains
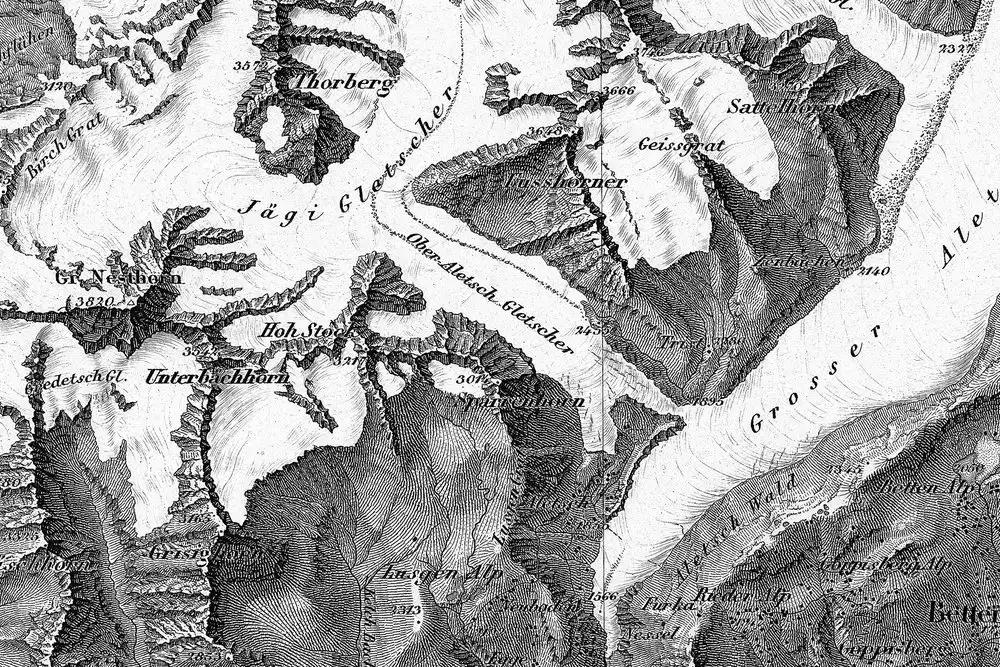
Part of Dufour Map sheet XVIII, Brieg and Airolo, dated 1854: the Aletsch glaciers and the ridges west of them. Engraved strokes called hachures run down each slope, and many slopes facing the lower right carry the darkest ones. This is the Swiss Alps, not the Cascade Range block shown above.
"Blatt XVIII, Brieg, Airolo (detail around the Aletsch glaciers), from Topographische Karte der Schweiz (Dufour Map), 1854, by Guillaume-Henri Dufour and the Eidgenössisches Topographisches Bureau" by Federal Office of Topography swisstopo — https://commons.wikimedia.org/wiki/File:Swisstopo_Dufourkarte_BLATT_XVIII_BRIEG_AIROLO_LT_TK_018_1854.tiff — swisstopo terms of use for free geodata (https://www.swisstopo.admin.ch/en/terms-of-use-free-geodata-and-geoservices); modified: cropped, resized; rights notice: ©swisstopo
Swiss maps settled on light from the northwest more than a century before the 2018 study. According to swisstopo, the Dufour Map was the first official map series to cover the whole of Switzerland, issued in 25 sheets at 1:100,000 between 1845 and 1865. Its ground is drawn with obliquely lit hachures engraved in copper, and swisstopo's history pages say its northwest light set the pattern for later official Swiss maps.
Not everyone agreed. In 1927 the geologist Albert Heim argued that the Sun lights Switzerland mostly from the south. Northwest light, he complained, put the vineyards and villages on the sunny side of the main Valais valley into shadow. He traced the convention to mapmakers who drew right-handed with their working light at the upper left; Hans von Steiger, a former engraver and director of the topographic service, rejected that explanation in 1931.
Heim lost. In April 1929, swisstopo's account says, the topographic service sent seven sample maps comparing northwest and southeast light to the General Staff, and kept the northwest light. One reason was practical: old and new maps would be used side by side for decades, and readers used to northwest light might read a south-lit map inside out. The habit of the eye that the 2018 paper describes was already an argument in the Swiss debate.
Real mountains also shape the air above them. The lenticular clouds page follows a cloud that sits over a mountain wave.
How is a hillshade computed?
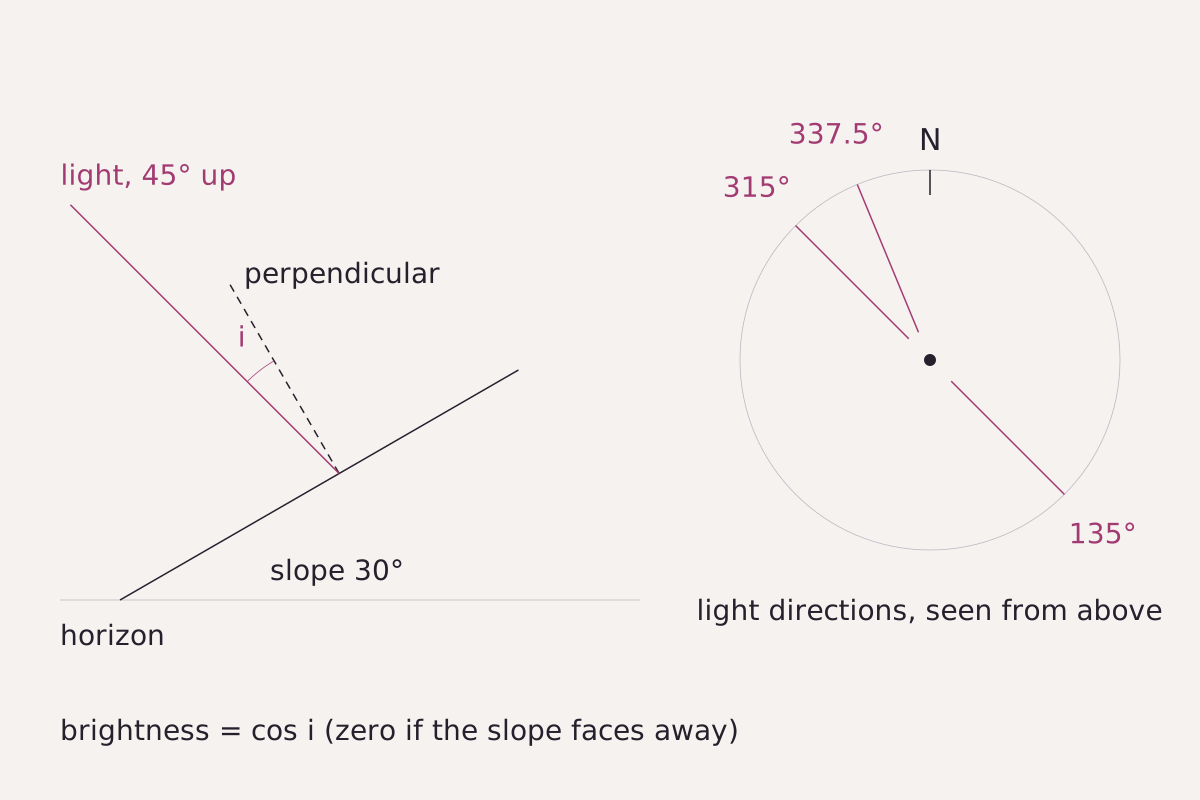
The geometry behind every pixel: brightness is the cosine of the angle i between the slope's perpendicular and the direction of the light. The compass, north at the top, marks the three light directions used on this page.
Benchmark Brightness computed with the cosine model used for the three maps; slope 30°, light 45° above the horizon; table rows taken from this page's CSV.
"Slope, perpendicular and light direction in a hillshade, schematic" by Meridian & Moraine, https://meridianandmoraine.com/contours/shaded-relief/, licensed under CC BY 4.0 (https://creativecommons.org/licenses/by/4.0/).
Data: Meridian & Moraine calculation
A hillshade starts from an elevation model, a grid of heights. For each cell, the heights of the cells around it give the steepness of the slope and the direction it faces. The cell's brightness is the cosine of the angle between the slope's perpendicular and the light: 1 for a slope that faces the light squarely, 0 for one turned away. Flat ground under a light 45° up comes out at 0.71.
The table gives the brightness of a 30° slope facing eight directions. Under the 315° light, a slope facing northwest is the brightest (0.97) and one facing southeast the darkest (0.26); under 135° the two trade values. The 337.5° light sits only 22.5° from 315°, so its map looks close to the usual one, with north-facing slopes a little brighter (0.94 against 0.86).
| Slope facing | Light from 315° | Light from 135° | Light from 337.5° |
|---|---|---|---|
| North | 0.86 | 0.36 | 0.94 |
| Northeast | 0.61 | 0.61 | 0.75 |
| East | 0.36 | 0.86 | 0.48 |
| Southeast | 0.26 | 0.97 | 0.29 |
| South | 0.36 | 0.86 | 0.29 |
| Southwest | 0.61 | 0.61 | 0.48 |
| West | 0.86 | 0.36 | 0.75 |
| Northwest | 0.97 | 0.26 | 0.94 |
| Flat ground | 0.71 | 0.71 | 0.71 |
Download the slope brightness table (CSV) (about this file) Data: Meridian & Moraine calculation
The light is the cartographer's cut of a shaded map. It is a setting, not a measurement, and it decides which slopes read as high. The three maps here make other cuts as well: heights are not stretched (z-factor 1), no ridge casts a shadow onto the next, and at about 12.9 m per pixel, gullies and knobs a few tens of meters across blur away. A contour map cuts differently, and how to read a topographic map covers the whole sheet.
Next time a shaded map looks wrong, find north first, then look at which side of the ridges carries the shadows. If the dark sides face the top of the page, turn the map upside down and look again; the 2018 paper notes that rotating such an image can turn a ridge into a valley, or back.
Next overpass
- Contour lines: the same mountains drawn with lines instead of light, where a V pointing uphill marks a stream valley.
- Richat Structure: real sunlight this time, falling on a ring of worn-down rock in the Sahara, read from orbit.
Sources
- Arzu Çöltekin, Victoria Rautenbach, Serena Coetzee and T. Mokwena, “Landform Perception Accuracy in Shaded Relief Maps: A Replication Study Confirms That NNW Lighting Is Better Than NW Against the Relief Inversion Effect,” International Archives of the Photogrammetry, Remote Sensing and Spatial Information Sciences XLII-4 (2018): 101–106, https://doi.org/10.5194/isprs-archives-XLII-4-101-2018. CC BY 4.0. doi.org/10.5194/isprs-archives-XLII-4-101…Read: full text, pages 101–106
- Federal Office of Topography swisstopo, “Dufour Map” (published 8 January 2024). www.swisstopo.admin.ch/en/dufour-mapRead: full page
- Federal Office of Topography swisstopo, “Digital Dufour Map” (published 8 January 2024). www.swisstopo.admin.ch/en/digital-dufour-mapRead: full page
- Federal Office of Topography swisstopo, “Un débat sur la lumière dans les cartes” (published 1 February 2023). www.swisstopo.admin.ch/fr/eclairage-20230201Read: full page (French)
- U.S. Geological Survey, 3D Elevation Program 1/3 arc-second Digital Elevation Model, tile n48w122 (USGS 1/3 Arc Second n48w122 20250813, publication date 2025-08-13), The National Map. prd-tnm.s3.amazonaws.com/StagedProducts/Elevation/13/TIFF/…Read: values: elevation grid windows 47.7725–47.7975° N, 121.365–121.315° W (33-0003); 47.75–47.83° N, 121.27–121.41° W (33-0011); 47.7725–47.7875° N, 121.350–121.318° W (33-0012)
Cite this page
The Reading Room. “Shaded Relief: Why Maps Light Mountains From the Northwest.” Meridian & Moraine, published 16 November 2026. https://meridianandmoraine.com/contours/shaded-relief/. Accessed on the date you read it.
How readings are checkedAll correctionsReport an error on this page (contact@meridianandmoraine.com)
More from Contours & Charts
Contours & Charts
Contour Lines: A V Pointing Uphill Marks a Stream Valley
Image credit
"Skykomish, Washington, topographic sheet (detail near Baring), 1902" by U.S. Geological Survey — https://commons.wikimedia.org/wiki/File:1902_USGS_topo_map_of_Baring,_Washington.jpg — Public domain (US: U.S. Government work (17 U.S.C. §105), USGS topographic sheet published 1902; EU: published 1902 by a U.S. federal agency, more than 70 years ago); modified: cropped
Contours & Charts
How to Read a Topographic Map: Start With the Interval
Image credit
"Teton Range crest (detail), from Grand Teton Quadrangle, Wyoming, USGS topographic sheet, 1929 printing" by U.S. Geological Survey — https://commons.wikimedia.org/wiki/File:1929_U.S.G.S._Map_of_Grand_Teton_National_Park,_Wyoming_-_Geographicus_-_GrandTeton-USGS-1929.jpg — Public domain (US: U.S. Government work (17 U.S.C. §105), USGS topographic sheet surveyed 1899 and first published 1901, this printing 1929 with National Park Service additions; EU: published by U.S. federal agencies more than 70 years ago); modified: cropped, rotated
Contours & Charts
California as an Island: A Map Error Preserved in Print
Image credit
"Amerique Septentrionale (detail: California and the Mar Vermejo), map by Nicolas Sanson, Paris, 1650" by Nicolas Sanson — https://commons.wikimedia.org/wiki/File:Sanson_Amerique_Septentrionale_1650_UTA.jpg — Public domain (US: first published 1650, before 1931; EU: mapmaker Nicolas Sanson died 1667, more than 70 years ago); modified: cropped, resized