Atmospheric River: Moving Water Vapor, Not a River of Cloud
The Reading Room Published
Short answer
An atmospheric river is a long, narrow, short-lived path where large amounts of water vapor move sideways, as the AMS Glossary of Meteorology defines it. The river is the moving vapor.
Viewing card
- Where
- 15.050°N–50.000°N, 170.000°W–110.000°W; eastern North Pacific toward California
- Seen from
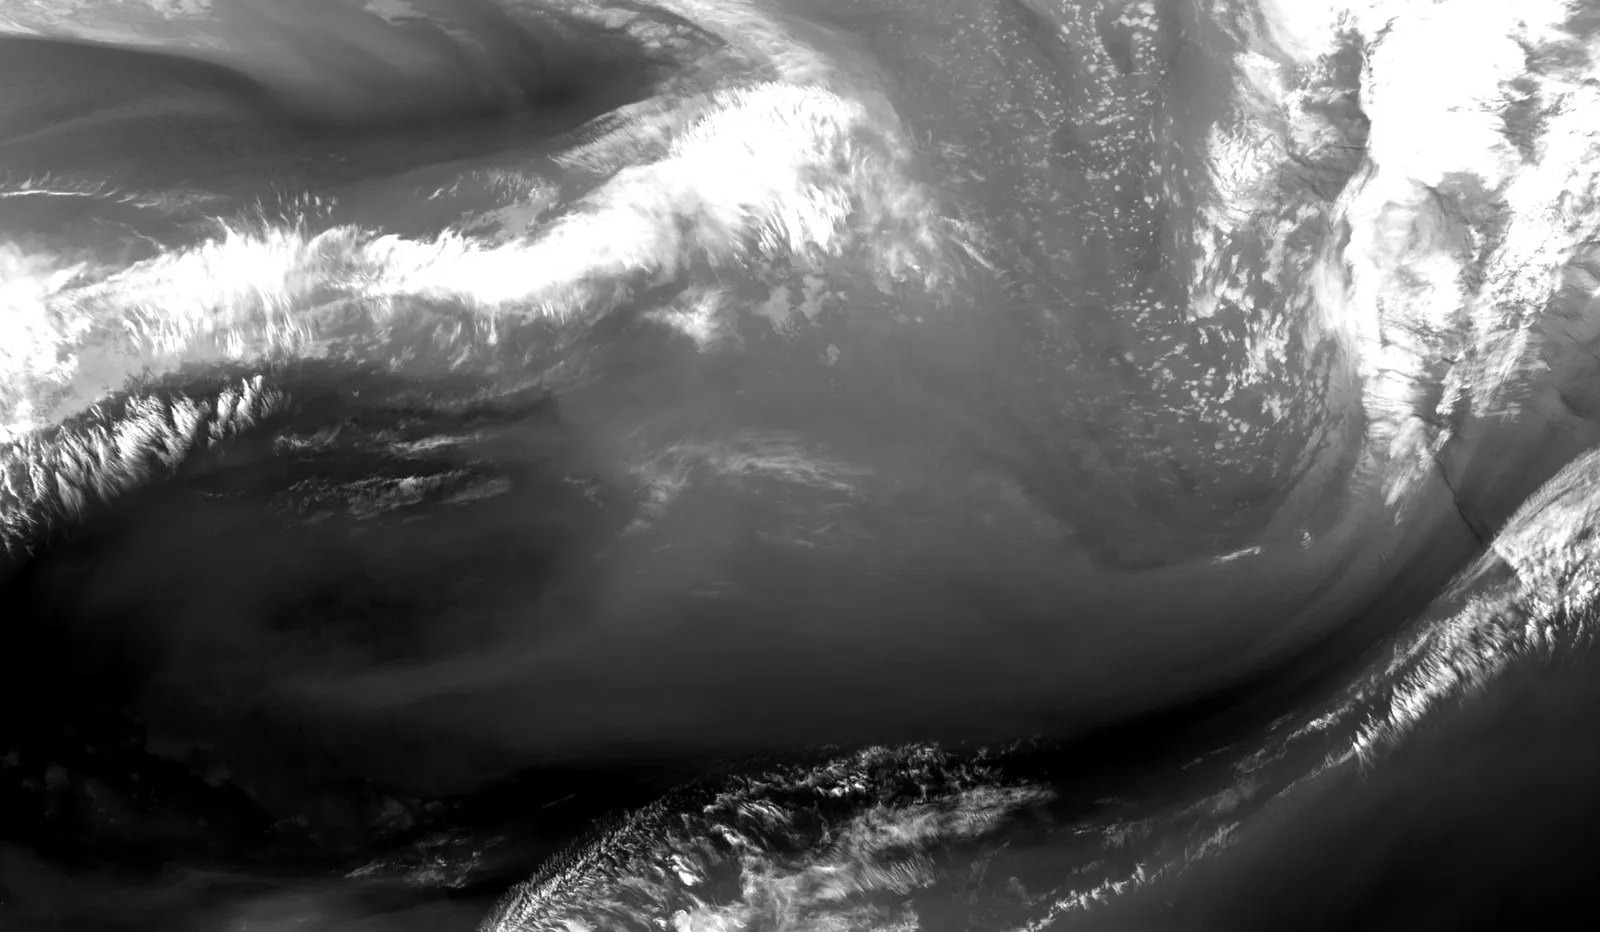
- GOES-18 ABI, band 10 (7.34 µm)
- Captured
- 2025-03-13 12:00 UTC scan start · NOAA ABI-L2-CMIPF via NODD (noaa-goes18 bucket).
- Reading altitude
- 3.42 km east–west × 4.16 km north–south pixels at 35°N; frame 60.0° × 34.95°, about 5,480 km wide at 35°N
- Written by
- Cold emission from moisture or cloud, per general NWS descriptions; the pale bands are visible in imagery, and the NWS Hanford summary dates the 12–14 March 2025 event without describing the image
Open the image full size · annotation layer (SVG)
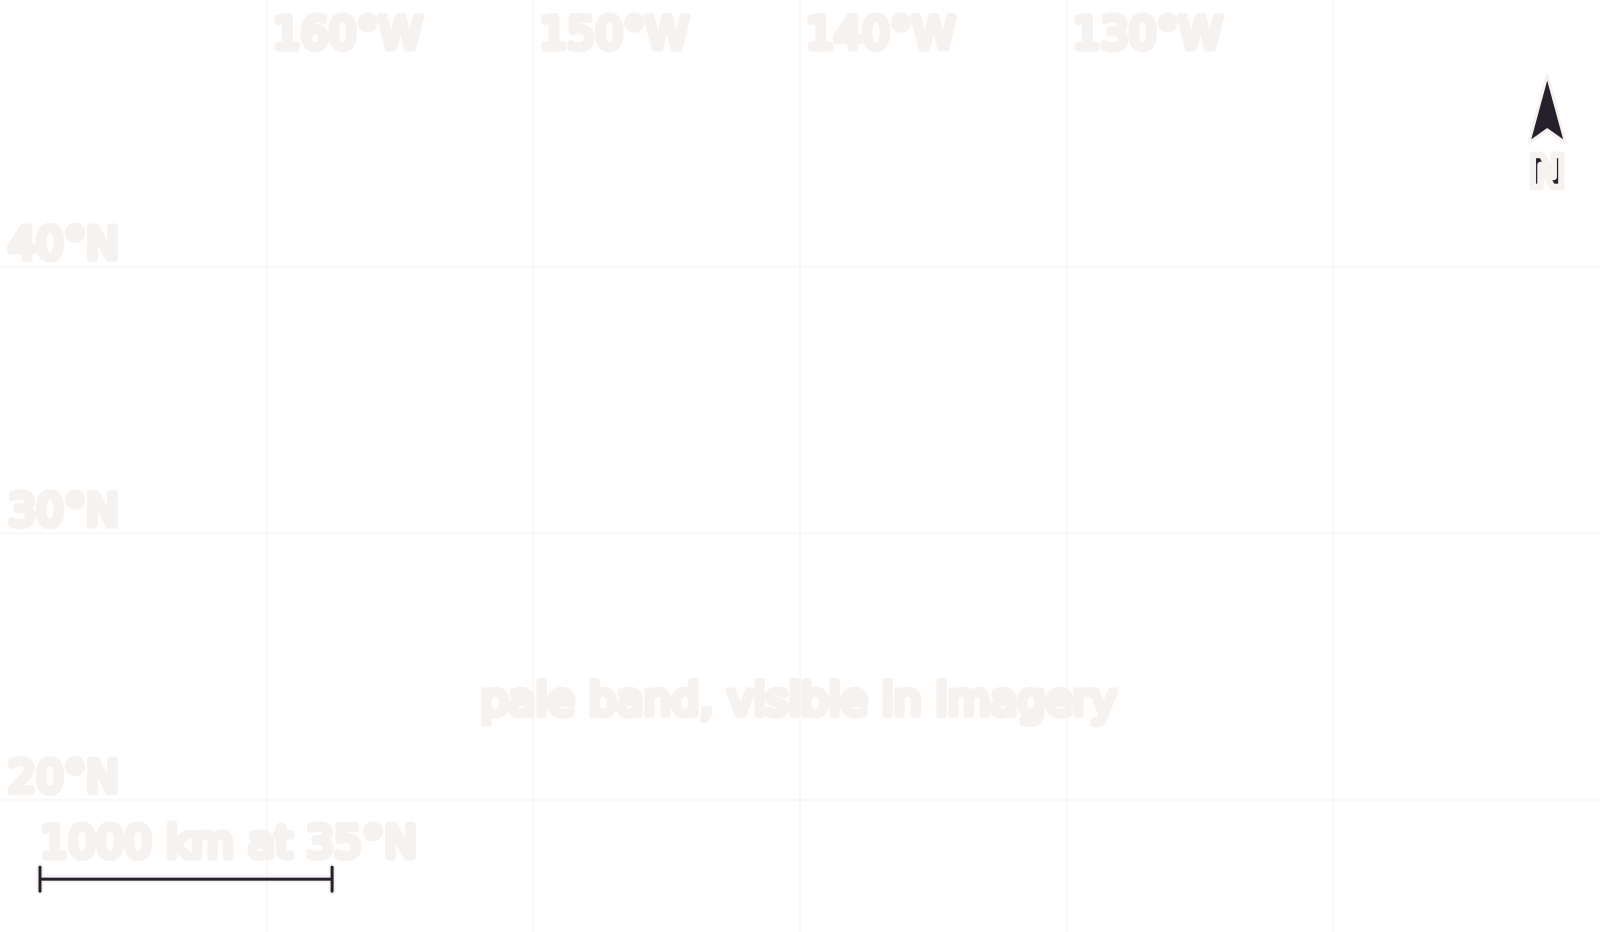
GOES-18 band 10 (7.34 µm) at 12:00 UTC on 13 March 2025, inside the 12–14 March atmospheric river event dated by the NWS Hanford office. Gray levels are brightness temperature, inverted so paler means colder, not total precipitable water. North is up; the scale bar holds at 35°N only.
Benchmark GOES-18 ABI ABI-L2-CMIPF band 10, scan start 2025-03-13 12:00 UTC, inside the 2025-03-12–2025-03-14 event window (Pacific local dates) given by the NWS Hanford March 2025 summary; inverted gray stretch 230–268 K, gamma 1; 1600 pixels wide, not enlarged; scale bar holds at 35°N only, within 0.06% of the geodesic distance.
Image
“Eastern North Pacific toward California, GOES-18 ABI band 10 (7.34 µm), scan start 2025-03-13 12:00:22 UTC”, Meridian & Moraine; public domain.
Full credit
"Eastern North Pacific toward California, GOES-18 ABI band 10 (7.34 µm), scan start 2025-03-13 12:00:22 UTC" by Meridian & Moraine — https://noaa-goes18.s3.amazonaws.com/ABI-L2-CMIPF/2025/072/12/OR_ABI-L2-CMIPF-M6C10_G18_s20250721200220_e20250721209540_c20250721210002.nc — Public domain (GOES-18 ABI ABI-L2-CMIPF band 10 (7.34 µm), scan start 2025-03-13 12:00:22 UTC, NOAA Open Data Dissemination (https://registry.opendata.aws/noaa-goes/); U.S. Government work (17 U.S.C. §105); this is not original, unaltered NOAA data); modified: subset, reprojected to a latitude/longitude grid, resampled, gray-scale stretch (inverted)
Annotation layer
"Annotation layer for Eastern North Pacific toward California" by Meridian & Moraine, https://meridianandmoraine.com/satellite/atmospheric-river/, licensed under CC BY 4.0 (https://creativecommons.org/licenses/by/4.0/).
On a water-vapor image, a pale band reaches from the subtropics toward North America. The band is a map of cold-reading radiation, while the river itself is a flow of vapor that no gray level measures. The image above comes from the GOES-18 weather satellite. It was taken during a March 2025 storm that the National Weather Service office in Hanford, California, calls a major atmospheric river event.
The pale shapes in the frame are visible in imagery. No source read for this page ties any one of them to that dated event, because the NWS summary gives dates for central California and does not describe the image. So that match stays short of the ground-truth gap, and the sections below keep the two apart. How the image was made is set out on the Benchmarks page.
What is an atmospheric river?
The AMS Glossary of Meteorology, in its “atmospheric river” entry, defines the term as “a long, narrow, and transient corridor of strong horizontal water vapor transport.” The entry says that corridor is typically tied to a low-level jet stream, a band of fast wind near the ground, ahead of the cold front of an extratropical cyclone. That is a large storm system of the middle latitudes, the kind drawn on weather maps as a low with fronts.
The same entry says the vapor comes from tropical sources, from sources outside the tropics, or from both. Heavy rain and snow often follow where the moist air is forced upward, for example by mountains. In the middle latitudes, the entry adds, most sideways vapor transport happens in these corridors and is focused in the lower troposphere, the lowest layer of the atmosphere.
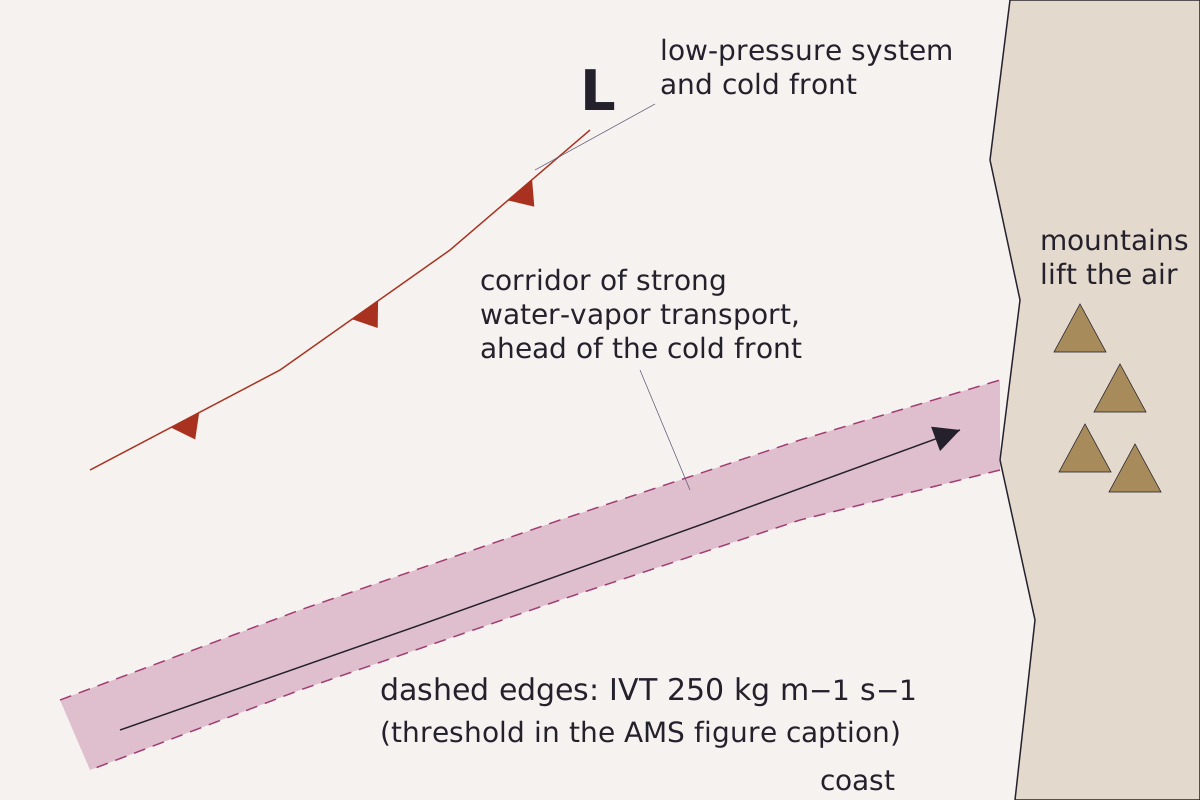
An atmospheric river in plan view, drawn from the AMS Glossary entry: a long, narrow corridor of strong vapor transport ahead of a cold front, reaching a coast where mountains lift the air. The dashed edges follow the threshold used in the entry's figure caption.
Benchmark Schematic, not to scale; corridor, front and mountains placed as the AMS Glossary entry describes them; edge threshold taken from the entry's figure caption.
"Atmospheric river in plan view (schematic)" by Meridian & Moraine, https://meridianandmoraine.com/satellite/atmospheric-river/, licensed under CC BY 4.0 (https://creativecommons.org/licenses/by/4.0/).
The amounts are large. On average, the AMS entry says, an atmospheric river carries more than double the flow of the Amazon River. The figure caption in the AMS entry draws the edges of an average river where the vapor transport, summed from the surface up to the 300 hPa pressure level, drops to 250 kg m−1 s−1. That unit counts the kilograms of vapor crossing each meter of width every second.
Read as handwriting, the corridor is a line of the day's shorthand written in vapor instead of cloud. The mechanism behind it is typically wind ahead of a cold front carrying moist air along one narrow path. Air pushed over a ridge can also build the lenticular clouds that hang over mountains, seen from the ground rather than from orbit.
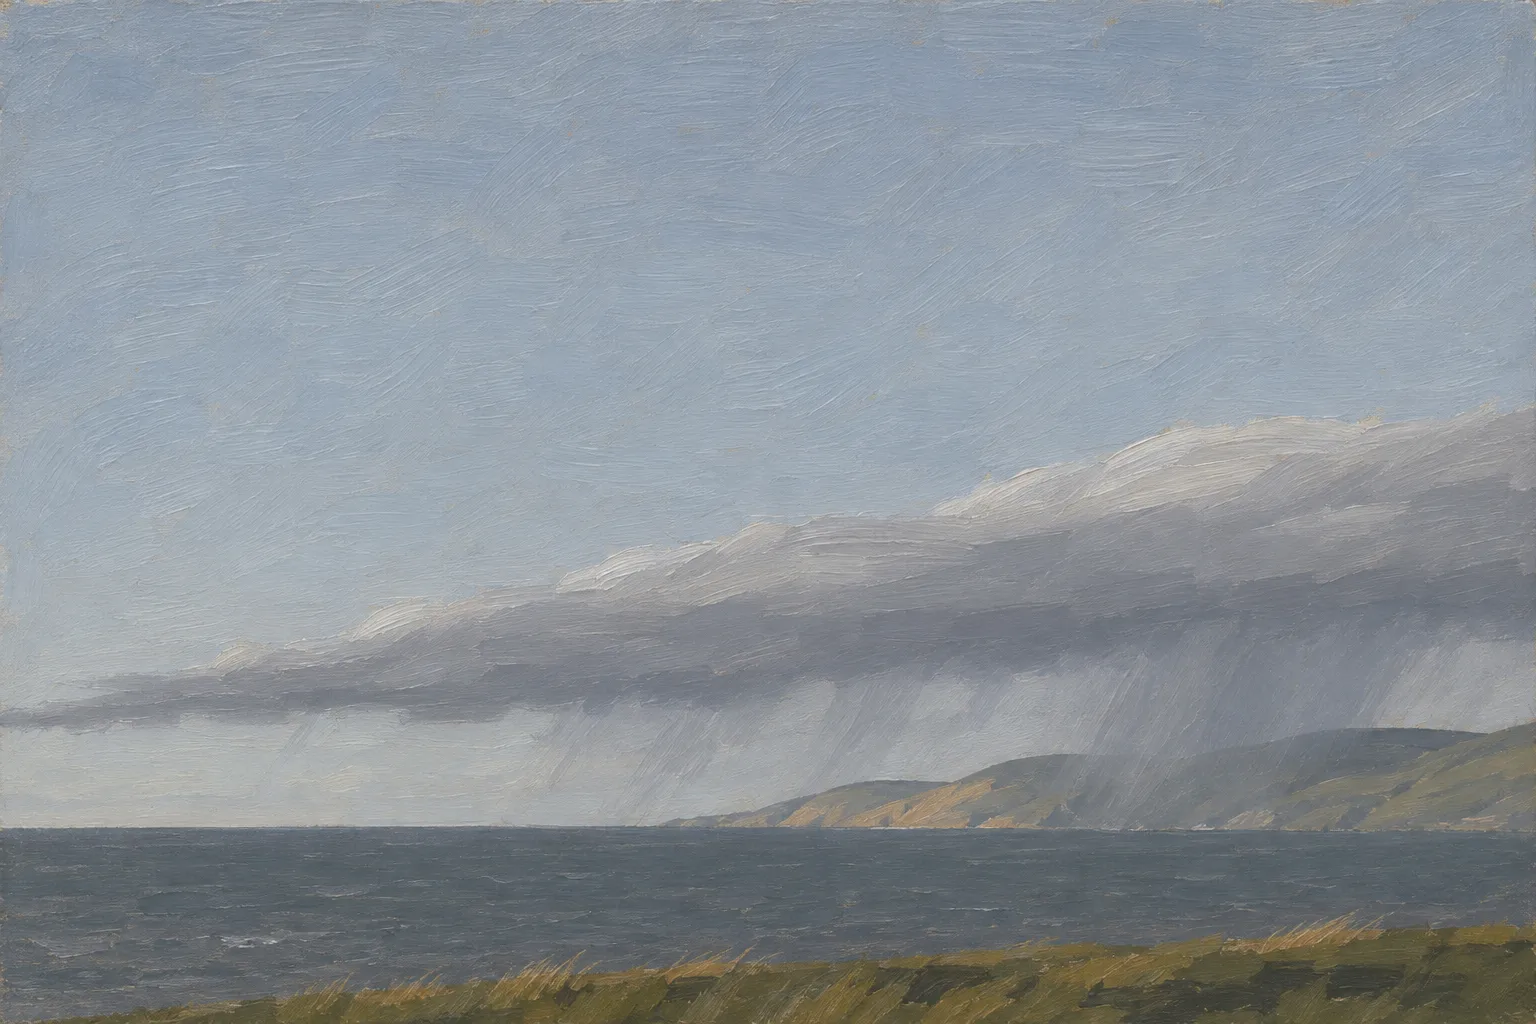
A long, narrow band of cloud comes in from the sea, and heavy rain often falls where the hills force the moist air upward. Illustration, not to scale.
Illustration: Meridian & Moraine. Generated illustration — not a photograph, satellite image or map; not to scale. Reuse: CC BY 4.0 (https://creativecommons.org/licenses/by/4.0/) to the extent any rights apply.
What does a water-vapor image show, and what does it miss?
Band 10 of the Advanced Baseline Imager on GOES-18 records infrared light at a central wavelength of 7.34 µm, according to the file's metadata. The file stores that signal as a brightness temperature. The AMS Glossary describes brightness temperature as the temperature a perfect emitter, called a blackbody, would need to give off the same amount of radiation at the same wavelength.
On this page, gray levels run from 230 K to 268 K and are inverted, so paler means colder. The picture is a brightness temperature, not total precipitable water, which is the depth of water all the vapor above a point would make if it condensed. Nor does it measure how much vapor flows sideways, the quantity in the AMS definition.
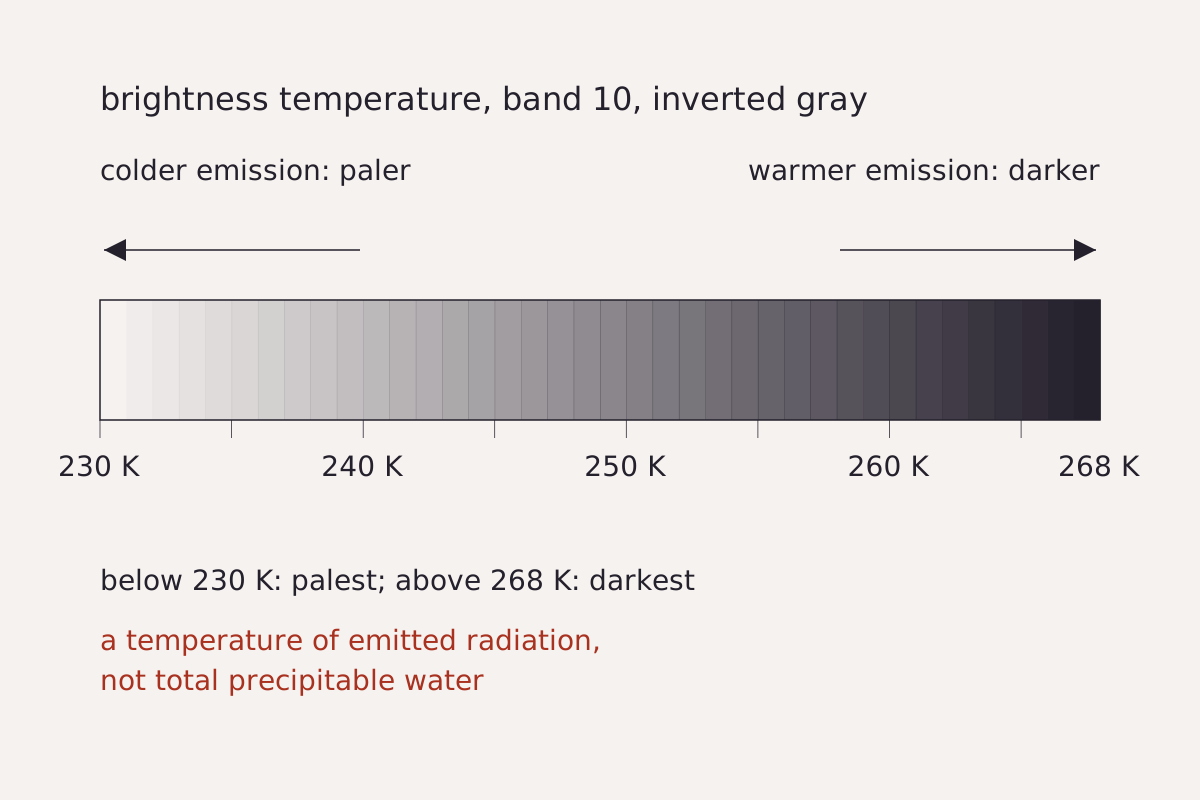
The gray scale used in the image at the top of this page: brightness temperature from 230 K (palest) to 268 K (darkest), inverted so that colder emission reads paler. Values outside the range take the end shades.
Benchmark Each gray step drawn from the stretch values in this page's CSV; 230–268 K, inverted, gamma 1.
"Gray scale of the GOES-18 band 10 image, 230–268 K inverted" by Meridian & Moraine, https://meridianandmoraine.com/satellite/atmospheric-river/, licensed under CC BY 4.0 (https://creativecommons.org/licenses/by/4.0/).
Download the image settings (CSV) (about this file)
Two National Weather Service office pages describe water-vapor pictures in general terms. The Morristown, Tennessee, office says they show how much moisture is in the upper atmosphere, with the most humid areas whitest. The Medford, Oregon, office says surface features are usually not apparent in its water-vapor images.
Neither page is about band 10 alone, and no readable source located for this page gives the height that band 10 reads. So no height appears here. Set beside the AMS entry, which puts most of the transport in the lower troposphere, a pale band works at most as a sign of moist air, not as a gauge of the river's flow.
Some of the palest streaks also have the fibrous look of cloud, visible in imagery, and the Morristown page notes that clouds read colder than land and water in infrared pictures.
When did scientists start calling it a river?
A 2018 paper in the Bulletin of the American Meteorological Society by F. Martin Ralph and colleagues says the term began to appear in modern scientific papers in the early 1990s. Its abstract describes a popular picture of a river of vapor overhead, not of liquid water, and some 20 years of differing views on the term among scientists.
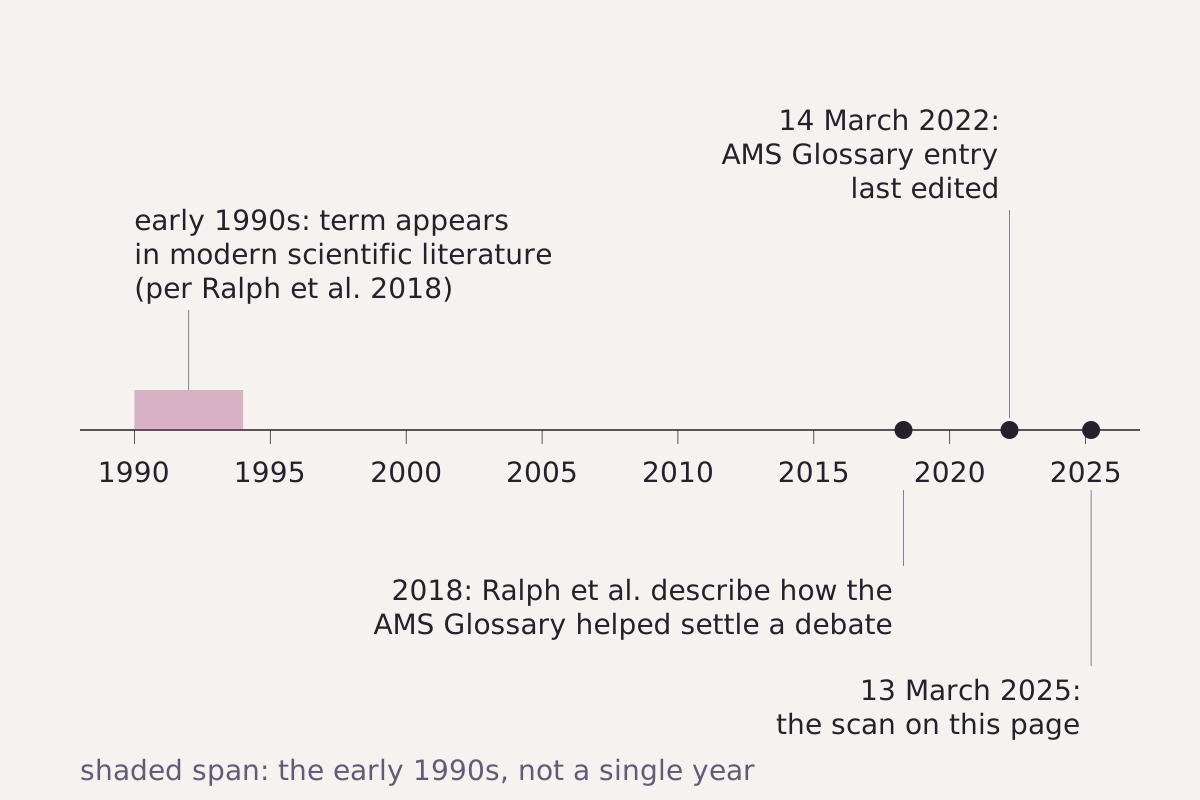
How the name reached this page: the early 1990s as Ralph et al. (2018) state it, their 2018 paper on the AMS Glossary definition, the date the AMS entry was last edited, and the scan shown above.
Benchmark Schematic timeline; years from the Ralph et al. (2018) abstract and the AMS Glossary entry, the scan date from the GOES-18 file; the early 1990s drawn as a span, not a single year.
"Atmospheric river: the name in four dates (schematic timeline)" by Meridian & Moraine, https://meridianandmoraine.com/satellite/atmospheric-river/, licensed under CC BY 4.0 (https://creativecommons.org/licenses/by/4.0/).
According to that 2018 abstract, some scientists saw the term as a duplicate of older ideas such as the warm conveyor belt, and others argued that comparing it with rivers on land was misleading. The paper's title credits the AMS Glossary with helping to resolve that debate. Only the abstract was read for this page, so the details of the argument are left to the paper.
The comparison has limits that a real river makes plain. The Mississippi beside an oxbow lake runs as liquid water in a channel cut into the ground, and its bends stay put for years. The AMS entry calls an atmospheric river transient, a corridor of vapor that forms, moves and fades with the storm that carries it.
Reading the March 2025 event
The March 2025 weather summary from the NWS office for the San Joaquin Valley in Hanford, California, covers the central California interior. It says: “A major atmospheric river event precipitated large snow and rain amounts on the 12th through 14th.” On the 13th, Bakersfield and Fresno each tied the record for the lowest daily high on that date, 53°F, and Madera tied one at 51°F, per the same summary.
The GOES-18 scan on this page began at 12:00:22 UTC on 13 March, which was 05:00 Pacific Daylight Time in California. That places it inside the dates the summary gives for the event.
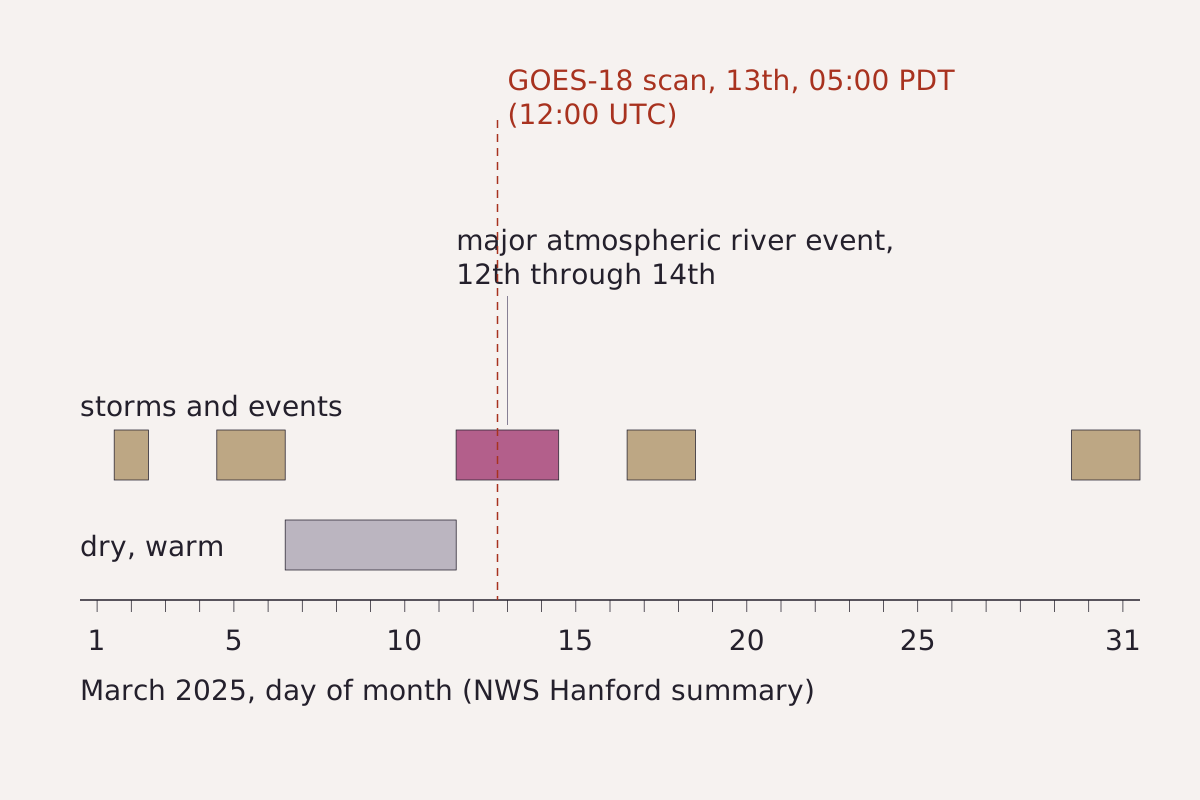
March 2025 in the central California interior, as the NWS Hanford summary tells it, with the major atmospheric river event on the 12th through 14th. The dashed line marks the GOES-18 scan used on this page.
Benchmark Each bar drawn from this page's CSV; dates from the NWS Hanford March 2025 summary; scan time from the GOES-18 file, converted to Pacific Daylight Time.
"March 2025 in the central California interior, with the GOES-18 scan time" by Meridian & Moraine, https://meridianandmoraine.com/satellite/atmospheric-river/, licensed under CC BY 4.0 (https://creativecommons.org/licenses/by/4.0/).
Download the March 2025 dates and scan time (CSV) (about this file)
This page reads one past event. For any storm now, forecasts and warnings come from the National Weather Service in the United States and from the national meteorological services of other countries.
The summary dates the event but does not say which shapes in the image carried its vapor. So the steps below stay with what is visible in imagery:
- Look at the lower middle of the image, near 20°N, where a pale, streaky band begins.
- Trace that band northeast to the frame's right edge, near 30°N.
- Find the second pale band across the upper left, near 40°N, and the large pale area along the right edge between about 35°N and 50°N.
- Compare the pale bands with the dark areas between them, which read warmer on this scale.
Next time a water-vapor image turns up in a weather story, find its gray scale first and check which way it runs. Then trace one pale band from end to end, and note the date and time printed with the image before matching it to any storm.
Next overpass
- Von Kármán vortex street: the same GOES-18 satellite, reading another kind of flow as swirls of cloud behind an island.
- Types of clouds: look up from the ground and name the clouds that moist air builds along the way.
Sources
- American Meteorological Society, "atmospheric river," Glossary of Meteorology (term edited 14 March 2022). glossary.ametsoc.org/wiki/atmospheric-river/Read: glossary entry and figure caption, paraphrased; one short quotation
- American Meteorological Society, "brightness temperature," Glossary of Meteorology. glossary.ametsoc.org/wiki/brightness-temperature/Read: glossary entry, paraphrased
- F. Martin Ralph, Michael D. Dettinger, Mary M. Cairns, Thomas J. Galarneau and John Eylander, "Defining 'atmospheric river': How the Glossary of Meteorology helped resolve a debate," Bulletin of the American Meteorological Society 99, no. 4 (2018): 837–839. pubs.usgs.gov/publication/70201113Read: abstract only, paraphrased
- JP Kalb and Brian Ochs, March 2025 Weather Summary for the Central California Interior (National Weather Service, WFO San Joaquin Valley–Hanford, 2025). www.weather.gov/media/hnx/MARCH%202025%20WEATHER%…Read: full text of the narrative and the daily records section
- National Weather Service, Morristown, Tennessee, "Types of Satellite Imagery." www.weather.gov/mrx/sattypeRead: full page
- National Weather Service, Medford, Oregon, "RADAR and Satellite Imagery." www.weather.gov/mfr/radar-satelliteRead: full page
- NOAA GOES-18 Advanced Baseline Imager, Level 2 Cloud and Moisture Imagery, full disk (ABI-L2-CMIPF), band 10, scan start 2025-03-13 12:00:22 UTC, file OR_ABI-L2-CMIPF-M6C10_G18_s20250721200220_e20250721209540_c20250721210002.nc, NOAA Open Data Dissemination. noaa-goes18.s3.amazonaws.com/ABI-L2-CMIPF/2025/072/12/OR_ABI-L…Read: file page: metadata and the subset used for the image
Cite this page
The Reading Room. “Atmospheric River: Moving Water Vapor, Not a River of Cloud.” Meridian & Moraine, published 16 November 2026. https://meridianandmoraine.com/satellite/atmospheric-river/. Accessed on the date you read it.
How readings are checkedAll correctionsReport an error on this page (contact@meridianandmoraine.com)
More from Read from Orbit
Read from Orbit
Oxbow Lake: A River Gets Shorter by Bending Too Far
Image credit
"Raccourci Lake (Old River), Louisiana true-color composite, Sentinel-2 L2A scene S2A_T15RXQ_20241021T165322_L2A via Earth Search (Element 84)" by Meridian & Moraine — https://earth-search.aws.element84.com/v1/collections/sentinel-2-c1-l2a/items/S2A_T15RXQ_20241021T165322_L2A — Copernicus Sentinel data legal notice (https://sentinels.copernicus.eu/documents/247904/690755/Sentinel_Data_Legal_Notice); modified: cropped, resampled, color-stretched; rights notice: Contains modified Copernicus Sentinel data 2024
Read from Orbit
Alluvial Fan: In Death Valley, Dark Is Older, Up to a Point
Image credit
"Death Valley Alluvial Fan from Dante's View" by Wilson44691 — https://commons.wikimedia.org/wiki/File:Death_Valley_Alluvial_Fan_from_Dante%27s_View.JPG — CC0 1.0 (https://creativecommons.org/publicdomain/zero/1.0/); modified: cropped, resized
Read from Orbit
Richat Structure: A Worn-Down Dome, Not an Impact Crater
Image credit
"Richat Structure, Adrar, Mauritania true-color composite, Sentinel-2 L2A scene S2A_T29QKD_20240126T111440_L2A via Earth Search (Element 84)" by Meridian & Moraine — https://earth-search.aws.element84.com/v1/collections/sentinel-2-c1-l2a/items/S2A_T29QKD_20240126T111440_L2A — Copernicus Sentinel data legal notice (https://sentinels.copernicus.eu/documents/247904/690755/Sentinel_Data_Legal_Notice); modified: cropped, resampled, color-stretched; rights notice: Contains modified Copernicus Sentinel data 2024