Von Kármán Vortex Street: An Island’s Wake, Seen From Orbit
The Reading Room Published
Short answer
A von Kármán vortex street is two staggered rows of eddies that spin in opposite directions behind an obstacle. Off Baja California, Guadalupe Island can leave one in the low cloud downwind.
Viewing card
- Where
- 25.305°N–29.500°N, 120.000°W–115.603°W (image frame); Guadalupe Island, off Baja California, near the top edge
- Seen from
- GOES-18 ABI, band 2 (0.64 µm)
- Captured
- 2023-04-27 00:16 UTC scan start · NOAA ABI-L2-CMIPC, OR_ABI-L2-CMIPC-M6C02_G18_s20231170016183_e20231170018558_c20231170019068.nc
- Reading altitude
- 0.61 km pixels at 27.5°N; frame 4.4° × 4.2°, about 434 km wide at 27.5°N; in the 2018 street the eddies along a row were about 64 to 89 km apart (per Horváth et al. 2020)
- Written by
- Low-level air splitting around Guadalupe Island under a temperature inversion sheds eddies from alternate sides; low cloud traces them (per Horváth et al. 2020)
This card as data (CSV) About this file
Data: Facts from A. Horváth et al., Journal of Geophysical Research: Atmospheres 125 (2020) e2019JD032121, open access under the Creative Commons Attribution License, https://doi.org/10.1029/2019JD032121
Open the image full size · annotation layer (SVG)
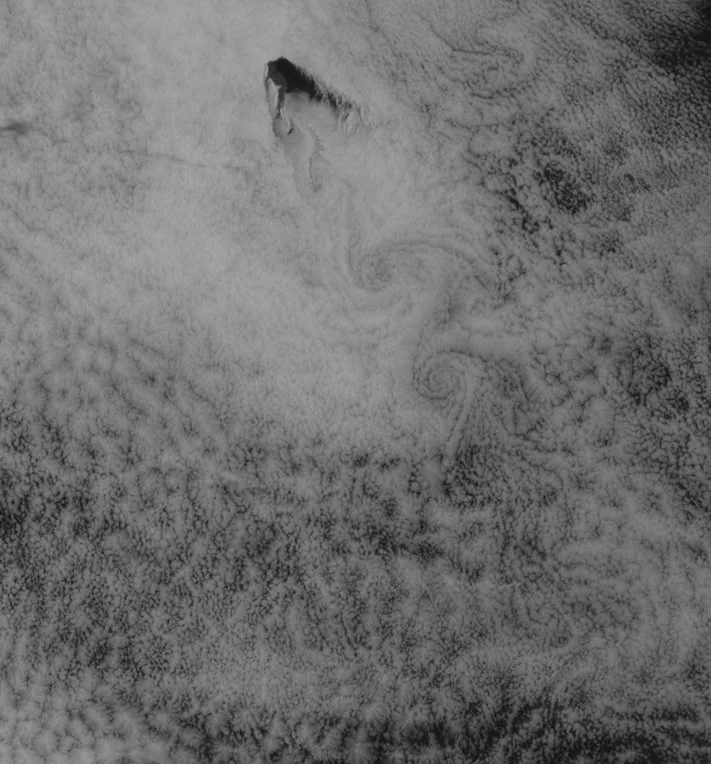
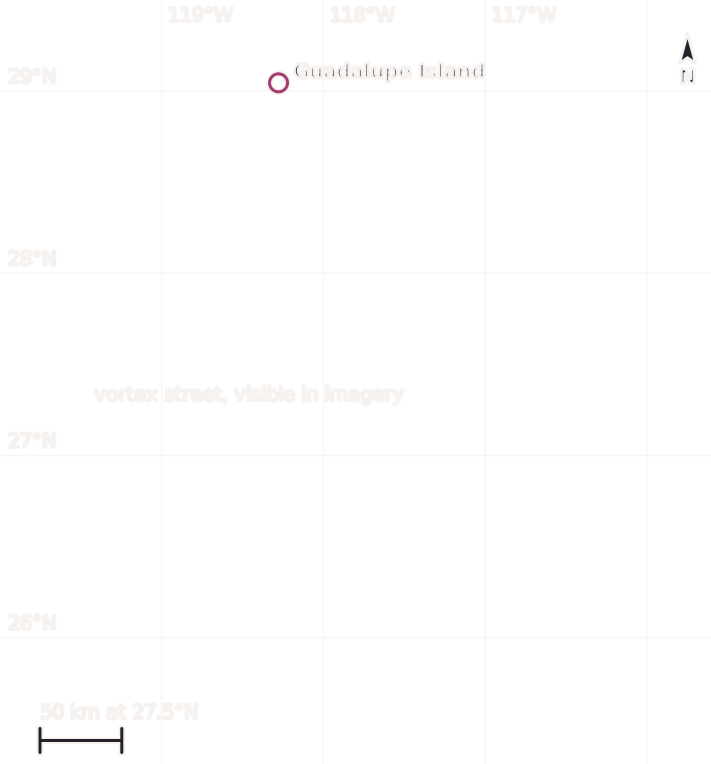
GOES-18 visible band 2 at 00:16 UTC on 27 April 2023. A deck of low cloud covers the ocean around Guadalupe Island; south and southeast of the island, eddies alternate left and right in a line, visible in imagery. North is up; the frame is about 434 km wide at 27.5°N, and the scale bar holds at that latitude only.
Benchmark GOES-18 ABI ABI-L2-CMIPC band 2, scan start 2023-04-27 00:16 UTC, matching the 00:16 UTC time on a dated Commons file record; gray stretch 0.02–0.6 reflectance factor, gamma 1.6; 711 pixels wide, not enlarged; scale bar holds at 27.5°N only, within 0.04% of the geodesic distance.
Image
“Guadalupe Island, Baja California, Mexico, GOES-18 ABI band 2 (0.64 µm), scan start 2023-04-27 00:16:18 UTC”, Meridian & Moraine; public domain.
Full credit
"Guadalupe Island, Baja California, Mexico, GOES-18 ABI band 2 (0.64 µm), scan start 2023-04-27 00:16:18 UTC" by Meridian & Moraine — https://noaa-goes18.s3.amazonaws.com/ABI-L2-CMIPC/2023/117/00/OR_ABI-L2-CMIPC-M6C02_G18_s20231170016183_e20231170018558_c20231170019068.nc — Public domain (GOES-18 ABI ABI-L2-CMIPC band 2 (0.64 µm), scan start 2023-04-27 00:16:18 UTC, NOAA Open Data Dissemination (https://registry.opendata.aws/noaa-goes/); U.S. Government work (17 U.S.C. §105); this is not original, unaltered NOAA data); modified: subset, reprojected to a latitude/longitude grid, resampled, gray-scale stretch
Annotation layer
"Annotation layer for Guadalupe Island, Baja California, Mexico" by Meridian & Moraine, https://meridianandmoraine.com/satellite/von-karman-vortex-street/, licensed under CC BY 4.0 (https://creativecommons.org/licenses/by/4.0/).
Behind a lone island, a flat deck of cloud breaks into a line of swirls. In measurements of a 2018 street off the same island, the swirls sat tens of kilometers apart, a spacing that fits a satellite frame hundreds of kilometers wide. Air flowing past the island sheds eddies from one side and then the other, and the low cloud carries their pattern downwind.
The image shows shapes, not causes. The line of swirls south of Guadalupe Island is visible in imagery. Calling it a vortex street made by the island crosses the ground-truth gap only because a 2020 study by Ákos Horváth and colleagues describes vortex streets in the lee of this same island in May 2018. That study covers the same island and the same kind of pattern, not this 2023 street, so its numbers appear below as a comparison, never as readings of this frame.
What is a von Kármán vortex street?
The American Meteorological Society's Glossary of Meteorology, in the “vortex street” entry, describes two parallel rows of alternately placed vortices “along the wake of an obstacle” in a fluid of moderate Reynolds number. The Reynolds number compares the push of a flow's momentum with the drag of its own viscosity. The glossary lists Kármán vortex street, vortex trail and vortex train as other names for it.
The glossary adds that such a street is stable only at a certain ratio between its width and the spacing of the vortices along it. Its shorter entry for a vortex cloud street describes clouds lined up along a vortex filament, a line where the spin of the flow is concentrated.
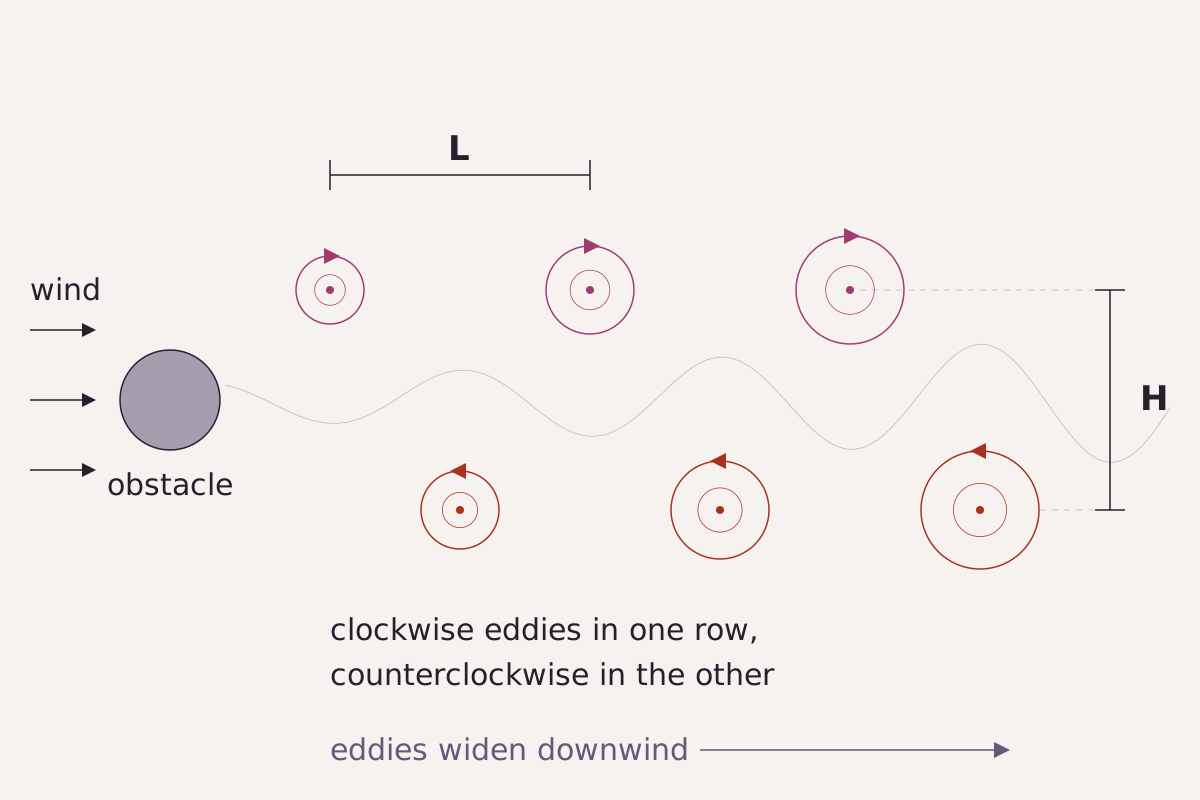
Two staggered rows of eddies trail an obstacle, one row turning clockwise and the other counterclockwise. L is the spacing between eddies in one row; H is the distance between the two rows.
Benchmark Schematic, not to scale; arrangement from the glossary definition, with H and L as defined in Horváth et al. (2020).
"A vortex street behind an obstacle (schematic)" by Meridian & Moraine, https://meridianandmoraine.com/satellite/von-karman-vortex-street/, licensed under CC BY 4.0 (https://creativecommons.org/licenses/by/4.0/).
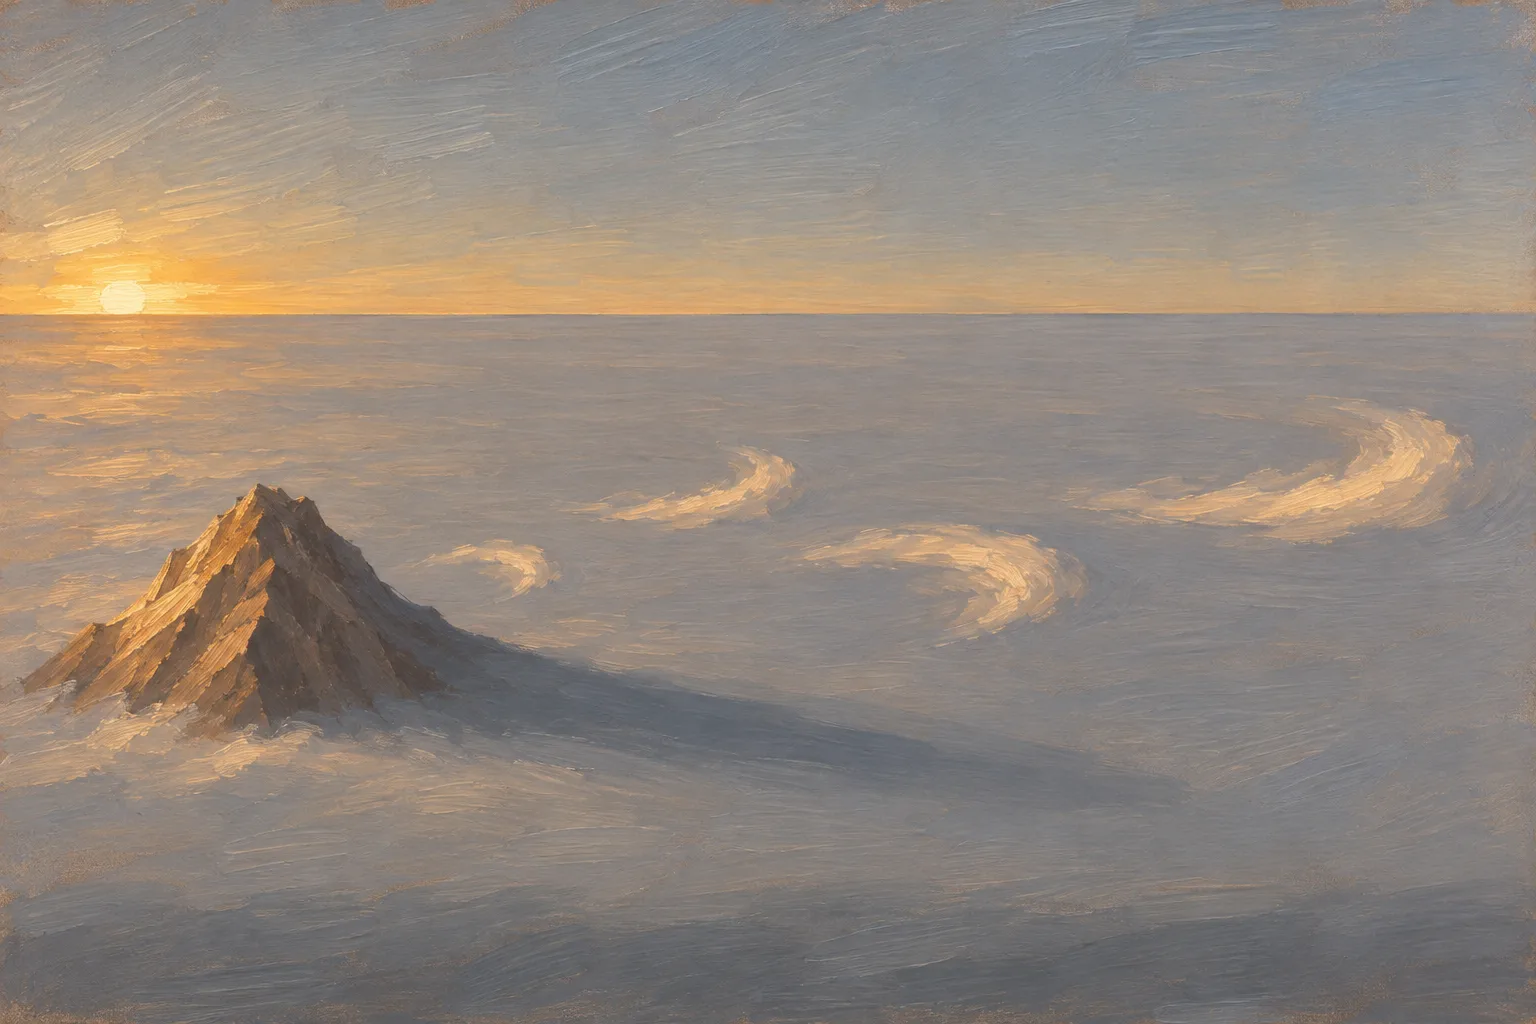
An island peak above a flat deck of low cloud, with eddies trailing downwind on alternating sides. Illustration, not to scale.
Illustration: Meridian & Moraine. Generated illustration — not a photograph, satellite image or map; not to scale. Reuse: CC BY 4.0 (https://creativecommons.org/licenses/by/4.0/) to the extent any rights apply.
In laboratory experiments, flow past a cylinder sheds vortices of alternate spin from alternate sides once the Reynolds number passes about 50, according to the 2020 paper by Horváth et al. As the vortices drift downstream, they settle into two staggered rows. The same paper credits Henri Bénard with photographing such streets in 1908, while the name went to Theodore von Kármán, who in 1911 and 1912 tied the vortices to the drag on the body.
Von Kármán also tested a simple model of the street for stability, as Horváth et al. (2020) summarize it. Every arrangement of the vortices was unstable except one staggered pattern, with the distance between the rows equal to 0.281 times the spacing along a row. Real streets rarely match that number, a point the size section below returns to.
How does an island make one in cloud?
Over the ocean, the obstacle is a mountainous island and the fluid is the lowest layer of air. Horváth et al. (2020) describe these streets as eddies in a well-mixed layer under a temperature inversion, a layer where air warms with height and acts as a lid. The eddies are “made visible by streaklines in stratocumulus clouds acting as tracer” (p. 2). The cloud only marks the street.
Read as handwriting, the street is a line of loops written on the cloud deck, each pulled from the opposite side of the island. Air near the sea tends not to rise over the peak, so it splits around the island's sides, and the two streams roll up into eddies of opposite spin that peel off in turn.
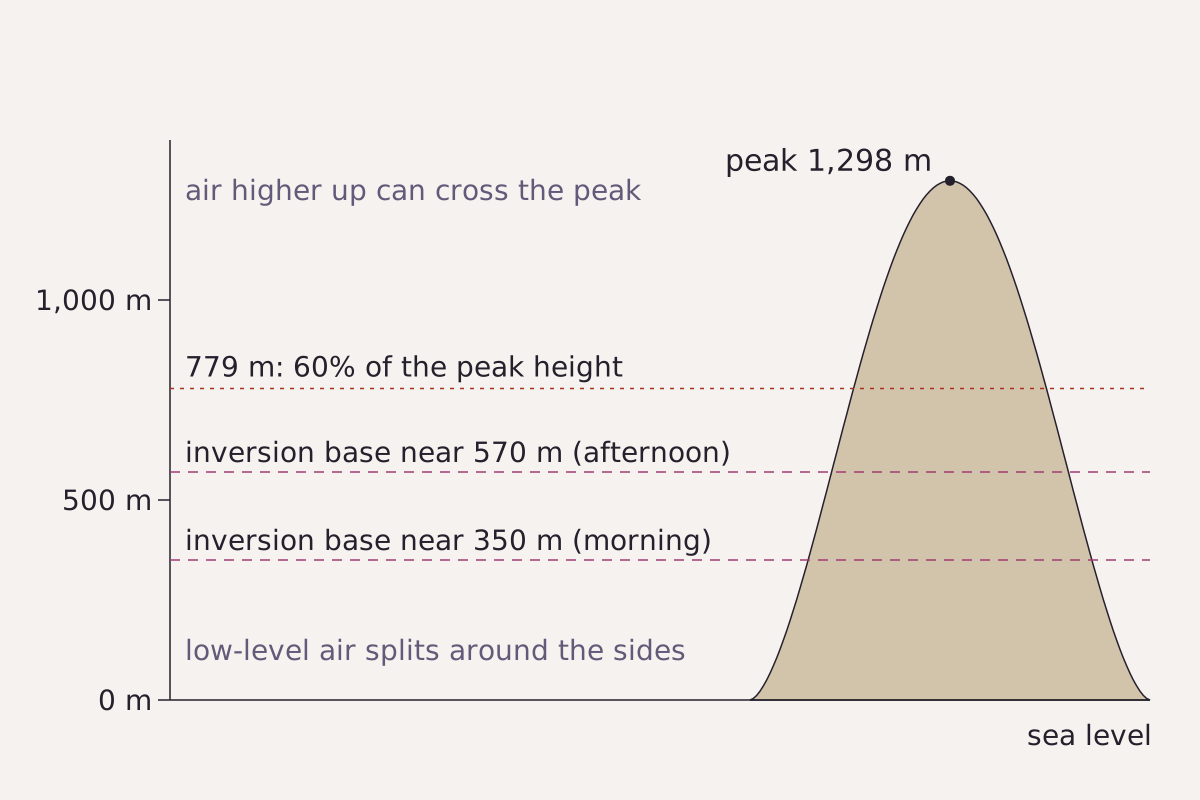
Guadalupe Island in side view, schematic. On 9 May 2018 the inversion base sat near 350 m in the morning and near 570 m later in the day. Air below a dividing height splits around the island; the 779 m line is 60% of the 1,298 m peak.
Benchmark Schematic, not to scale; peak height, inversion heights and the 60% line from Horváth et al. (2020); 0.6 × 1,298 m recomputed as 778.8 m.
"Guadalupe Island, inversion heights and the 60 percent line (schematic)" by Meridian & Moraine, https://meridianandmoraine.com/satellite/von-karman-vortex-street/, licensed under CC BY 4.0 (https://creativecommons.org/licenses/by/4.0/).
Data: Heights from A. Horváth, W. Bresky, J. Daniels, J. Vogelzang, A. Stoffelen, J. L. Carr, D. L. Wu, C. Seethala, T. Günther and S. A. Buehler, Evolution of an Atmospheric Kármán Vortex Street From High-Resolution Satellite Winds: Guadalupe Island Case Study, Journal of Geophysical Research: Atmospheres 125 (2020) e2019JD032121, open access under the Creative Commons Attribution License, https://doi.org/10.1029/2019JD032121
The 2020 study measures how much air splits with the Froude number, a ratio of the flow's momentum to the buoyancy of layered air. Laboratory tests with layered flows found vortex shedding only when this number stayed below 0.4. At Guadalupe that means the split flow must reach at least 60% of the island's height, about 779 m. On 9 May 2018 the dividing height stayed mostly above that line.
The study also found shedding across 7 to 9 May and again on 11 May 2018, with a weak wake and no vortices on 10 May. Winds came from the northwest at 7 to 12 m s−1. The paper likens the island's long shape to a tilted flat plate, and under those winds the north shore acted as the leading edge and the south shore as the trailing edge.
The Reynolds number is harder to pin down. Using the viscosity of air gives values of 108 to 1010, which would mean wild turbulence, yet the cloud patterns look like laboratory flows below about 300. The paper explains that matching them requires a much larger eddy viscosity, whose right value for air is still debated, so the comparison can only be qualitative.
Reading the Guadalupe Island street
The 2023 frame at the top is a single snapshot, so it shows shape, not spin. Horváth et al. (2020) measured spin a different way, by tracking cloud features in GOES-16 images taken every 5 minutes. A still image can be read in four steps:
- Find the island. It is the dark shape near the top edge, left of center, beside its label.
- Trace downwind from its southern shore. The first swirls sit close behind the island, and each later one sits on the opposite side of the line.
- Lay the 50 km scale bar, valid at 27.5°N, between two swirls on the same side.
- Follow the line until the swirls fade into patchy cloud with dark gaps, all visible in imagery.
During the 2018 case, the northwesterly wind set the street running toward the southeast. The wind on 27 April 2023 was not read for this page, so the direction of the 2023 line, mostly south, is visible in imagery only. From space, this cloud street is one of many shapes that need distance to read, like the rings of the Richat Structure.
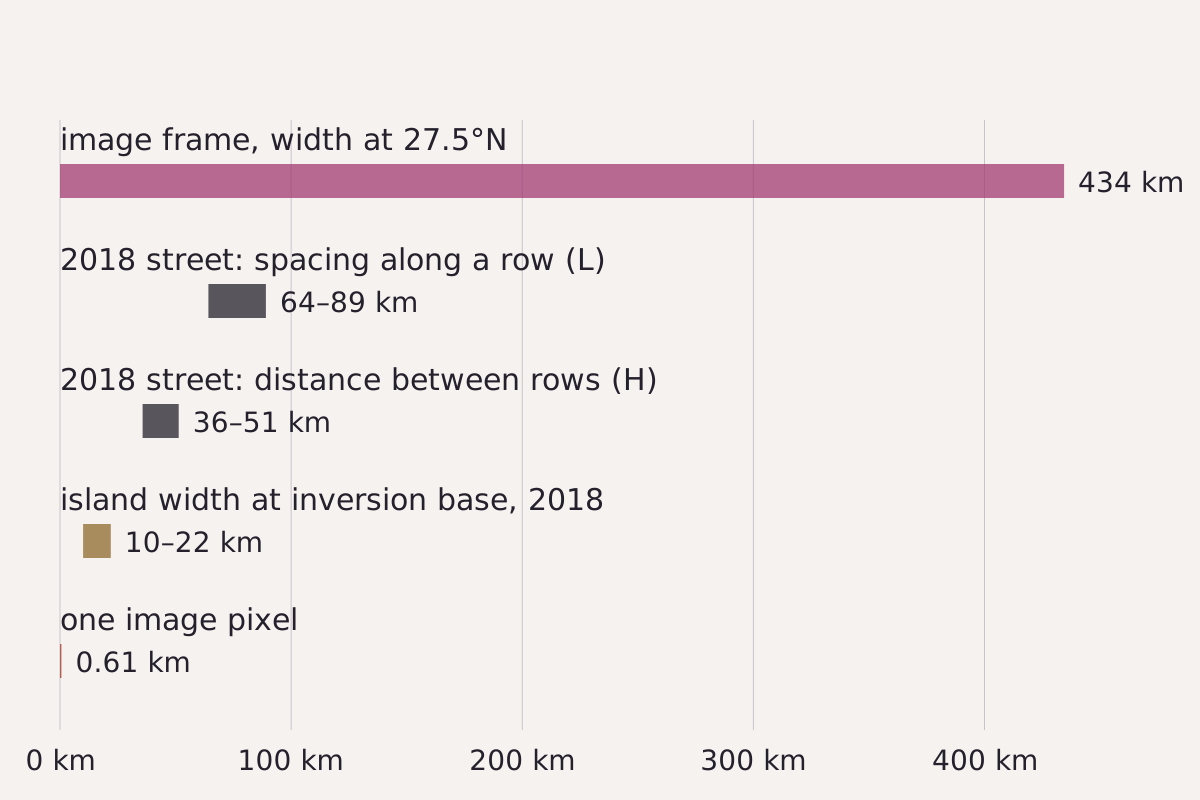
Sizes on one scale: the width of this page's 2023 frame and one of its pixels, next to the spacing measured by Horváth et al. (2020) in the 2018 street and the island's width at the inversion base that day.
Benchmark Each bar drawn from this page's CSV; frame and pixel widths calculated on the WGS84 ellipsoid at 27.5°N; 2018 values from the tables in Horváth et al. (2020).
"Vortex street sizes against the image frame" by Meridian & Moraine, https://meridianandmoraine.com/satellite/von-karman-vortex-street/, licensed under CC BY 4.0 (https://creativecommons.org/licenses/by/4.0/).
Data: 2018 sizes from A. Horváth et al., Journal of Geophysical Research: Atmospheres 125 (2020) e2019JD032121, Tables 1 and 2, open access under the Creative Commons Attribution License, https://doi.org/10.1029/2019JD032121; Frame and pixel widths from NOAA GOES-18 ABI data (public domain), calculated on this page
| Quantity | Value | Applies to | Source |
|---|---|---|---|
| Image frame width at 27.5°N | 434 km | This page's GOES-18 image, 2023 | Grid box, calculated |
| Image pixel width at 27.5°N | 0.61 km | This page's GOES-18 image, 2023 | Grid spacing, calculated |
| Spacing along a row (L) | 64–89 km | Guadalupe street, 9 May 2018 | Horváth et al. 2020 |
| Distance between rows (H) | 36–51 km | Guadalupe street, 9 May 2018 | Horváth et al. 2020 |
| Island width at inversion base | 10–22 km | Guadalupe Island, 9 May 2018 | Horváth et al. 2020 |
Download the vortex street scales (CSV) (about this file) Data: Values from A. Horváth et al., Journal of Geophysical Research: Atmospheres 125 (2020) e2019JD032121, open access under the Creative Commons Attribution License, https://doi.org/10.1029/2019JD032121; Frame and pixel widths from NOAA GOES-18 ABI data (public domain)
At 0.61 km per pixel, a gap of 64 to 89 km would span about 105 to 146 pixels, which is why the swirls stay readable without enlarging the image. The file name, band, stretch and grid of the frame are in the image record (CSV) (about this file). A deck like this one, seen from a summit above it, is also where a Brocken spectre can appear.
What sets the size of the swirls?
Horváth et al. (2020) name one length as the scale that sets vortex spacing: the island's width across the wind at the height of the inversion base. At Guadalupe that width changed by a factor of two on 9 May 2018, from 10 to 22 km, as the inversion rose and the wind turned.
The shape of a street is often given as an aspect ratio, H divided by L. Laboratory streets measured between 0.15 and 0.45, rising with distance downstream instead of holding at von Kármán's 0.281. For 30 island streets with straight center lines, an earlier satellite study found a mean of 0.42, with a 95% confidence interval of 0.36 to 0.47, as the 2020 paper reports.
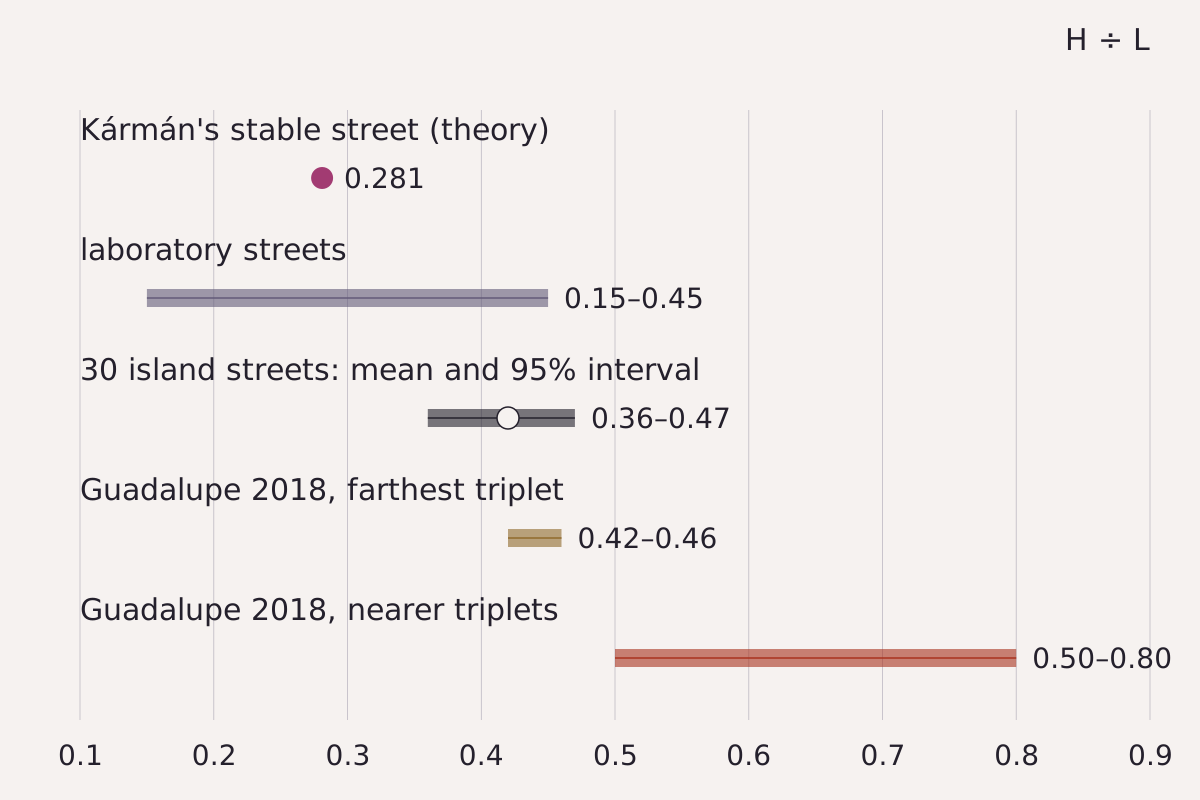
The ratio of row distance to spacing, H divided by L, from theory, the laboratory, 30 island streets and the 2018 Guadalupe street. The Guadalupe values come from three sets of three vortices measured at three times that day.
Benchmark Each mark drawn from this page's CSV; Guadalupe ratios recomputed from H and L in the 2020 table, all nine within rounding.
"Vortex street aspect ratios from theory, laboratory and islands" by Meridian & Moraine, https://meridianandmoraine.com/satellite/von-karman-vortex-street/, licensed under CC BY 4.0 (https://creativecommons.org/licenses/by/4.0/).
Data: Ratios from A. Horváth et al., Journal of Geophysical Research: Atmospheres 125 (2020) e2019JD032121, pp. 2-3 and Table 2, open access under the Creative Commons Attribution License, https://doi.org/10.1029/2019JD032121
| Street | H ÷ L | Note |
|---|---|---|
| Von Kármán's stable street | 0.281 | Theory, ideal fluid |
| Laboratory streets | 0.15–0.45 | Rises downstream |
| 30 island streets | 0.42 (0.36–0.47) | Mean and 95% interval |
| Guadalupe 2018, farthest vortices | 0.42–0.46 | Least affected by the wind shift |
| Guadalupe 2018, nearer vortices | 0.50–0.80 | Distorted by the wind shift |
Download the vortex street scales (CSV) (about this file) Data: Values from A. Horváth et al., Journal of Geophysical Research: Atmospheres 125 (2020) e2019JD032121, open access under the Creative Commons Attribution License, https://doi.org/10.1029/2019JD032121; Frame and pixel widths from NOAA GOES-18 ABI data (public domain)
At Guadalupe, the farthest set of vortices kept a ratio of 0.42 to 0.46, inside the 95% interval reported for regular island streets. Nearer sets ran from 0.50 to 0.80, because a westerly turn of the wind during the day pushed the street out of shape. The time between two vortices of the same spin was 2 to 4 hours.
The two rows were not equal either. Eddies spinning counterclockwise, the cyclonic ones, kept higher peak spin than clockwise ones at the same distance, and the clockwise ones lost spin about twice as fast. The authors trace this to two effects, Earth's rotation and the island's plate-like shape, and leave their shares for future models to settle.
Next time a visible satellite image shows low cloud around an island, find the island first and trace the line downwind. Then compare the distance between the two rows with the spacing along one row. If the first is a little under half the second, the ratio sits near the 0.42 mean reported for 30 regular island streets.
Next overpass
- Atmospheric river: the same satellite series reads another kind of airflow, a long corridor of water vapor.
- Lenticular clouds: air crossing a mountain ridge, read from the ground as stacked, lens-shaped clouds.
Sources
- American Meteorological Society, "vortex street," Glossary of Meteorology. glossary.ametsoc.org/wiki/vortex-street/Read: glossary entry, paraphrased with one short quotation
- American Meteorological Society, "vortex cloud street," Glossary of Meteorology. glossary.ametsoc.org/wiki/vortex-cloud-street/Read: glossary entry, paraphrased
- Ákos Horváth, Wayne Bresky, Jaime Daniels, Jur Vogelzang, Ad Stoffelen, James L. Carr, Dong L. Wu, Chellappan Seethala, Tobias Günther and Stefan A. Buehler, "Evolution of an Atmospheric Kármán Vortex Street From High-Resolution Satellite Winds: Guadalupe Island Case Study," Journal of Geophysical Research: Atmospheres 125, no. 4 (2020): e2019JD032121. doi.org/10.1029/2019JD032121Read: full text: abstract, sections 1–3, the shedding-period passage of section 4, section 5 and Tables 1–2 checked
- NOAA GOES-18 Advanced Baseline Imager, Level 2 Cloud and Moisture Imagery, CONUS sector, band 2, file OR_ABI-L2-CMIPC-M6C02_G18_s20231170016183_e20231170018558_c20231170019068.nc (scan start 2023-04-27 00:16:18 UTC), NOAA Open Data Dissemination. noaa-goes18.s3.amazonaws.com/ABI-L2-CMIPC/2023/117/00/OR_ABI-L…Read: full file header, plus the pixels inside the frame
- Wikimedia Commons file record for a GOES-18 image of vortices off Guadalupe Island, dated 27 April 2023, 00:16 UTC (used for date, time and place only). commons.wikimedia.org/wiki/File:Beautiful_von_Karman_Vo…Read: file page: date, time and place fields only

Cite this page
The Reading Room. “Von Kármán Vortex Street: An Island’s Wake, Seen From Orbit.” Meridian & Moraine, published 16 November 2026. https://meridianandmoraine.com/satellite/von-karman-vortex-street/. Accessed on the date you read it.
How readings are checkedAll correctionsReport an error on this page (contact@meridianandmoraine.com)
More from Read from Orbit
Read from Orbit
Oxbow Lake: A River Gets Shorter by Bending Too Far
Image credit
"Raccourci Lake (Old River), Louisiana true-color composite, Sentinel-2 L2A scene S2A_T15RXQ_20241021T165322_L2A via Earth Search (Element 84)" by Meridian & Moraine — https://earth-search.aws.element84.com/v1/collections/sentinel-2-c1-l2a/items/S2A_T15RXQ_20241021T165322_L2A — Copernicus Sentinel data legal notice (https://sentinels.copernicus.eu/documents/247904/690755/Sentinel_Data_Legal_Notice); modified: cropped, resampled, color-stretched; rights notice: Contains modified Copernicus Sentinel data 2024
Read from Orbit
Alluvial Fan: In Death Valley, Dark Is Older, Up to a Point
Image credit
"Death Valley Alluvial Fan from Dante's View" by Wilson44691 — https://commons.wikimedia.org/wiki/File:Death_Valley_Alluvial_Fan_from_Dante%27s_View.JPG — CC0 1.0 (https://creativecommons.org/publicdomain/zero/1.0/); modified: cropped, resized
 Illustration
Read from Orbit
Atmospheric River: Moving Water Vapor, Not a River of Cloud
Image credit (illustration)
Illustration: Meridian & Moraine. Generated illustration — not a photograph, satellite image or map; not to scale. Reuse: CC BY 4.0 (https://creativecommons.org/licenses/by/4.0/) to the extent any rights apply.